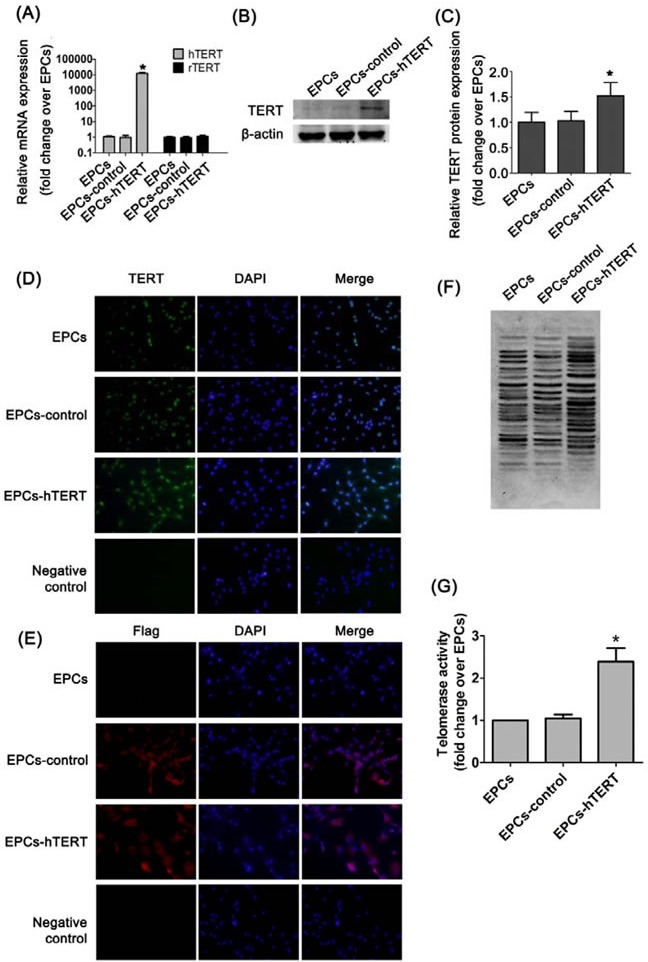
Figure 2. hTERT expression in EPCs after transduction.

(A) hTERT and rTERT mRNA expression were detected using real-time quantitative PCR analysis. (B) and (C) Western blotting analysis was used to evaluate TERT protein level in cells. (D) Immunofluorescence staining revealed the distribution of TERT protein in EPCs, EPCs-control and EPCs-hTERT (200×). (E) Immunofluorescence staining revealed the distribution of flag protein in EPCs, EPCs-control and EPCs-hTERT (200×). (F) and (G) Telomerase activity was detected using TRAP. *P<0.05 vs. EPCs.
