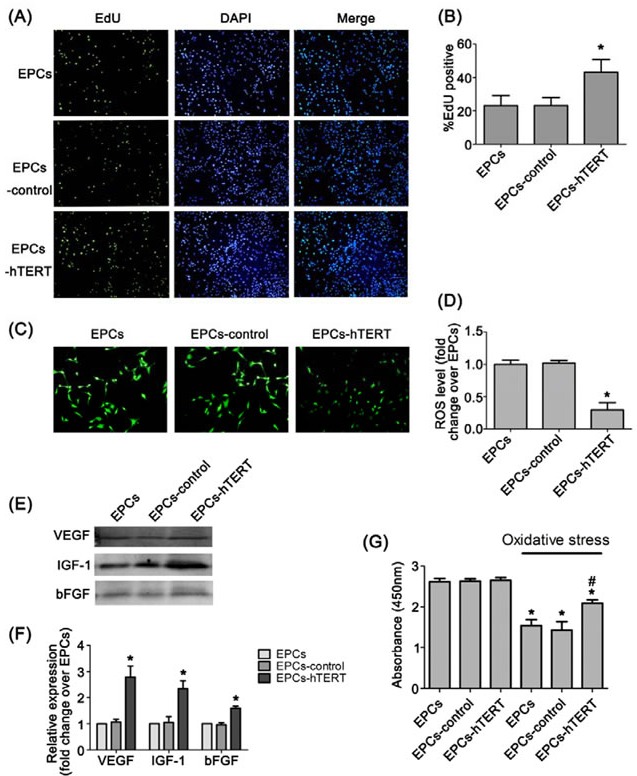
Figure 3. Characterization of hTERT-overexpressing rat EPCs.

(A) and (B) EdU staining indicates that hTERT overexpression increased EPCs proliferation (100×). (C) and (D) Intracellular ROS and fluorescence intensity analysis in EPCs, EPCs-control and EPCs-hTERT (100×). (E) and (F) The amount of VEGF, IGF-1 and bFGF secretion from EPCs-hTERT was detected using western blotting. (G) CCK-8 assay was used to evaluate the anti-oxidant capacity of EPCs-hTERT. *P<0.05 vs. EPCs, # P<0.05 vs. EPCs in oxidative stress.
