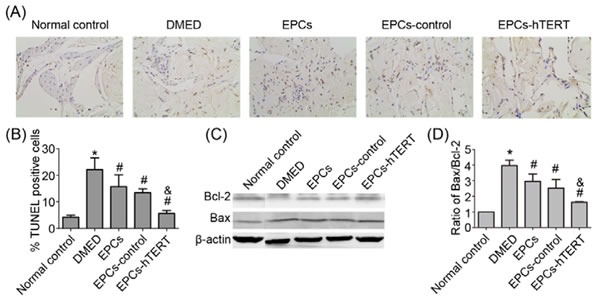
Figure 6. EPCs-hTERT-induced changes in the apoptotic index and expression of apoptosis-related protein levels.

(A) Apoptotic cells were stained using the TUNEL method (100×). (B) The apoptotic index represents the percentage of apoptotic cells within the total number of cells in a given area. (C) Western blotting was used to evaluate the expression of Bcl-2 and Bax. (D) Bar graph depicts the ratio of Bax and Bcl-2. *P<0.05 vs. normal control group, # P<0.05 vs. DMED group, & P<0.05 vs. EPCs group and EPCs-control group.
