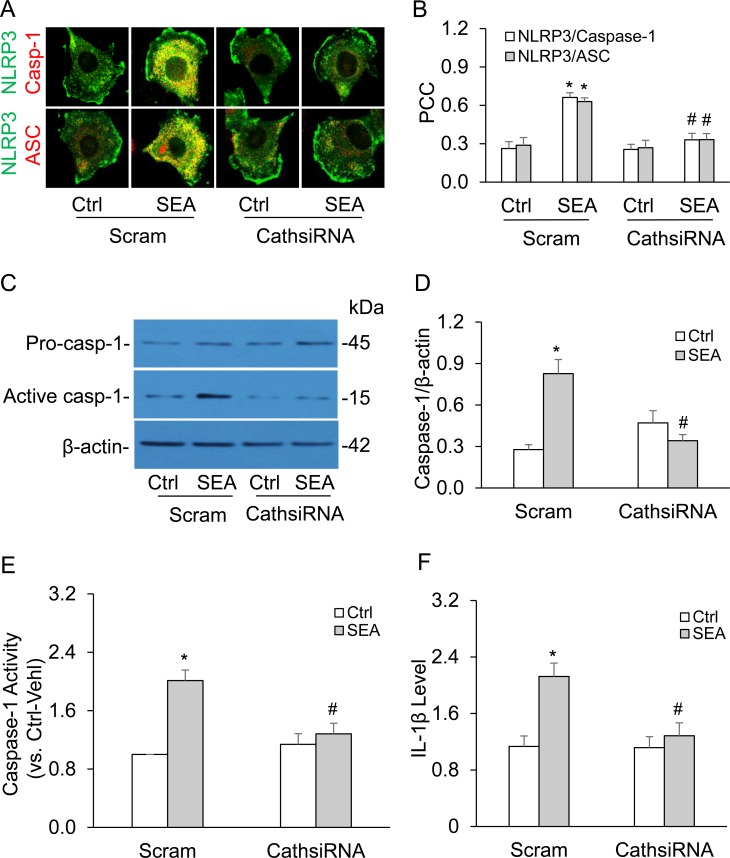
Figure 6. Cathepsin B gene silencing inhibited SEA-induced NLRP3 inflammasome activation in HSCs.
A. Representative confocal fluorescence images show the co-localization of NLRP3 with ASC or caspase-1. B. Summarized data show co-localization coefficiency of NLRP3 with ASC or caspase-1 (n = 5). C. and D. Representative Western blot documents and summarized data (n = 6). E. and F. Data summary shows relative caspase-1 activity (n = 6) and IL-1β production compared with control (n = 5). Scram, scrambled siRNA; CathsiRNA, Cathepsin B siRNA. Data are expressed as means ± SEM. *p < 0.05 versus scrambled control group; #p < 0.05 versus scramble + SEA group.

