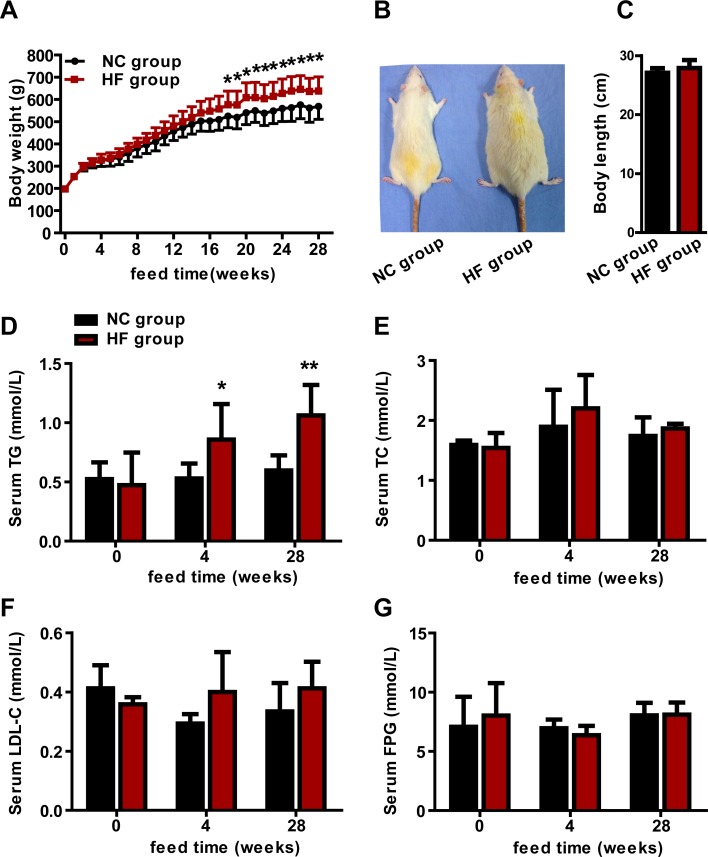
Figure 1. The effect of a HF diet on rat body weight, body length and serum lipid profile.
Rats were fed a NC diet or a HF diet. A. The body weights of the rats were monitored weekly. B. Representative gross morphology of rats at 28 weeks. C. Body lengths of rats at 28 weeks. The serum TG D., TC E., LDL-C F. and FPG G. levels of the rats were assayed at 0, 4 and 28 weeks. The data are expressed as the mean ± SD (n = 20 per group). * p < 0.05, ** p < 0.01 versus the corresponding NC group.

