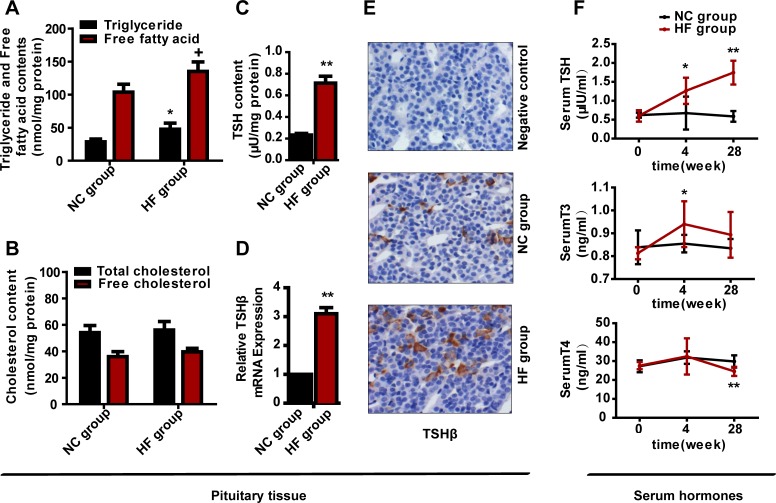
Figure 2. The effect of a HF diet on rat pituitary-thyroid axis hormone levels.
Rats were fed a NC diet or a HF diet for 28 weeks. A. Rat pituitary TG and free fatty acid contents were assayed and corrected against the corresponding total protein content. B. Rat pituitary TC and free cholesterol contents were assayed and corrected against the corresponding total protein content. C. TSH content in each pituitary. The total pituitary content of TSH was measured by ELISA and corrected against the total protein content. D. Tshβ gene expression. E. Representative images of TSHβ immunohistochemical staining are shown (magnification, × 200). All positive immunostaining is indicated by brown in the cytoplasm. F. Serum TSH, T3 and T4 levels at 0, 4 or 28 weeks. The data are expressed as the mean ± SD (n = 20 per group). + p < 0.05, * p < 0.05, ** p < 0.01 versus the corresponding NC group.

