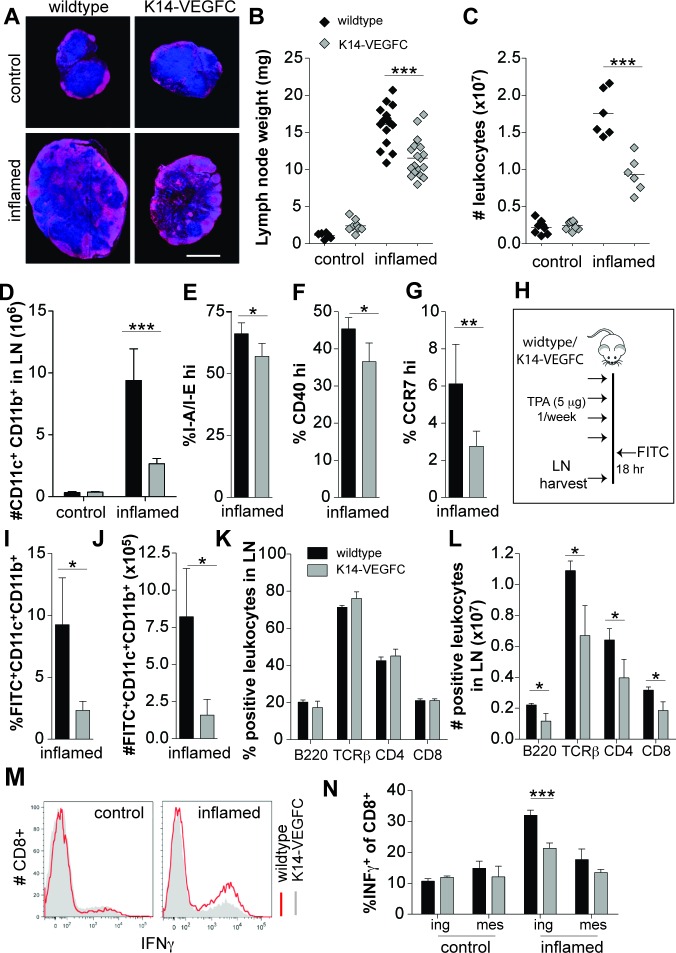
Figure 2. A reduced inflammatory response is observed in skin-draining inguinal LNs of K14-VEGFC mice.
Skin-draining inguinal LNs of untreated and inflamed wildtype and K14-VEGFC mice were harvested. Central transverse sections of inguinal LNs were stained for B220 (red) and Hoechst (blue). Representative immunofluorescent images are shown in (A) (Scale bar: 1 mm). LNs were weighed (B) and the cellularity determined using a hemocytometer (C) Each data point represents a single lymph node. The horizontal line represents the mean. Inguinal LNs from untreated (n = 3 per genotype) and inflamed (n = 4 per genotype) mice were analysed for their numbers of CD11c+CD11b+ cells using flow cytometry (D) Proportions of I-A/I-Ehi (E), co-stimulatory CD40hi (F) and CCR7hi(G) cells were also quantified on CD11c+CD11b+ cells within inflamed inguinal LNs (n = 4, 4, and 7, respectively). Data are presented as mean ± SD. To investigate the ability of CD11c+CD11b+ cells to migrate from inflamed skin to skin-draining LNs, 5% FITC thioglycolate/acetone 1:1 v/v was applied to the inflamed backskin of wildtype (n = 4) and K14-VEGFC mice (n = 4) see schematic (H) The proportions of FITC-positive CD11c+CD11b+ cells in the draining LNs (axillary + inguinal) were quantified by flow cytometry (I) and the total number of migrating cells calculated (J) Proportions of B220, TCRβ, CD4 and CD8 positive cells were quantified using flow cytometry in skin-draining inguinal LNs from inflamed wildtype (n = 3) and K14-VEGFC (n = 3) mice (K) Total cellularity in the lymph node for each marker was also quantified and is shown in (L) Leukocytes isolated from inguinal and mesenteric LNs were stimulated with PMA/ionomycin and analysed for IFN-γ-production. Representative flow cytometry histograms are shown (M) Proportions of IFN-γ+CD8+ T cells in leukocytes isolated from control and inflamed mice are shown (N) (n = 4 per treatment and genotype). All data are presented as mean ± SD. Figures B-D were analysed using Two-way ANOVA with Bonferroni's post-test to assess statistical significance. Student's t-test was applied to all other figures. *p < 0.05,**p < 0.01 ***p < 0.001.

