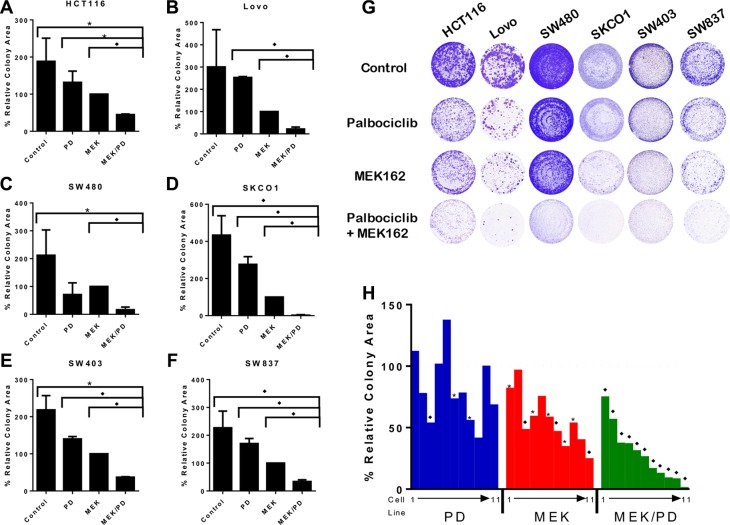
Figure 1. Combination of MEK and CDK4/6 inhibitors markedly attenuates cell growth in vitro in a panel of KRAS mutant CRC cell lines.
(A–F), Colony assays for six representative cell lines treated with the CDK4/6 inhibitor palbociclib (PD), the MEK inhibitor MEK162 (MEK), the combination (MEK/PD), or with DMSO control for 10–14 days. Results are normalized to MEK162 monotherapy. The data represent mean values ± SD for 3–4 independent experiments. (G), Depiction of the stained cell wells. (H), Summary colony assay results for a panel of 11 KRAS mutant CRC cell lines treated with DMSO control, PD, MEK, or MEK/PD at concentrations approximating the IC50 for MEK monotherapy for 10–14 days. Results here are normalized to DMSO control. A waterfall plot is depicted showing values, with cell lines consistently depicted in the same order of T84, LS174T, SW1116, SW948, LS1034, HCT116, SW837, SW403, SW480, Lovo, and SKCO1. The data represent mean values for 3–4 independent experiments. *p < 0.05, *p < 0.006. All p-values were generated by Student's t-test.

