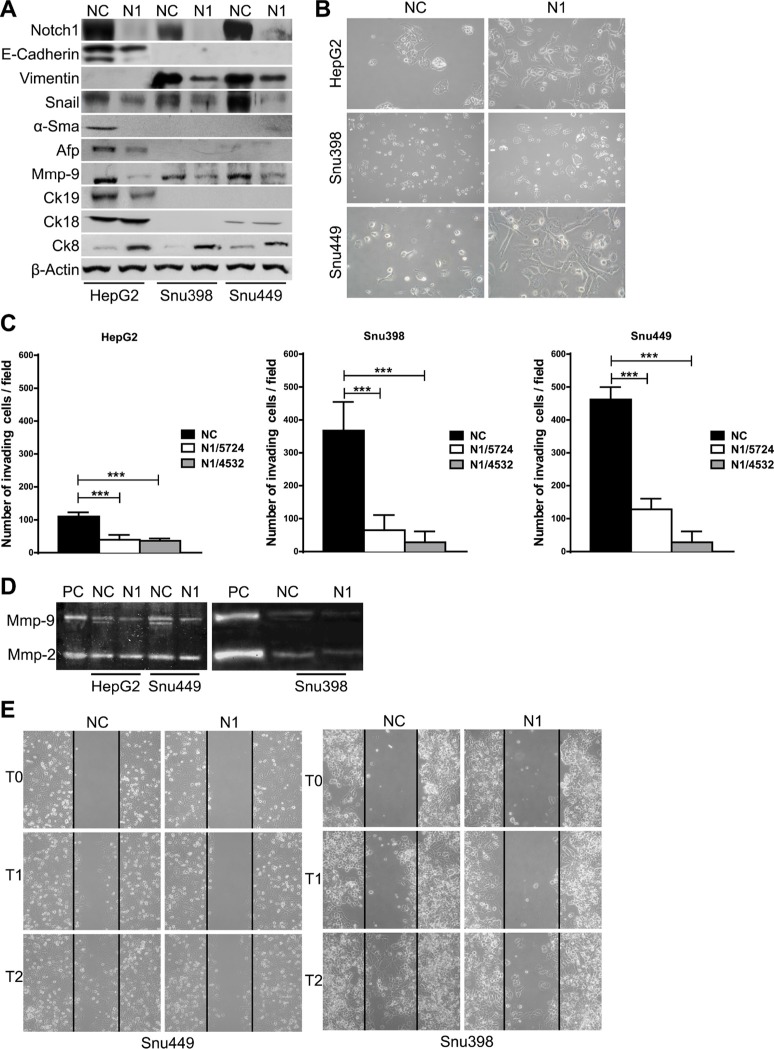
Figure 2. Effect of Notch1 knockdown.
(A) Proteins expression analysis in negative control cells and in Notch1 silenced cells by western blot. (B) Morphology of negative control shRNA and Notch1 depleted cells. (C) Difference in invasiveness ability of negative control cells and Notch1 silenced cells. ShOligos targeted to different Notch1 exons were used (N1/5724 and N1/4532). Results are the mean of three independent experiments (+/− S.E.). ***P < 0.001 (by two tailed student's t test). (D) Zymographic analysis of the Mmp-9 and Mmp-2 activity. PC: positive control. (E) Wound healing assay demonstrates that there are significantly more negative control cells that migrate into the wound area compared with Notch1 silenced cells. NC: negative control shRNA; N1: Notch1 shRNA.

