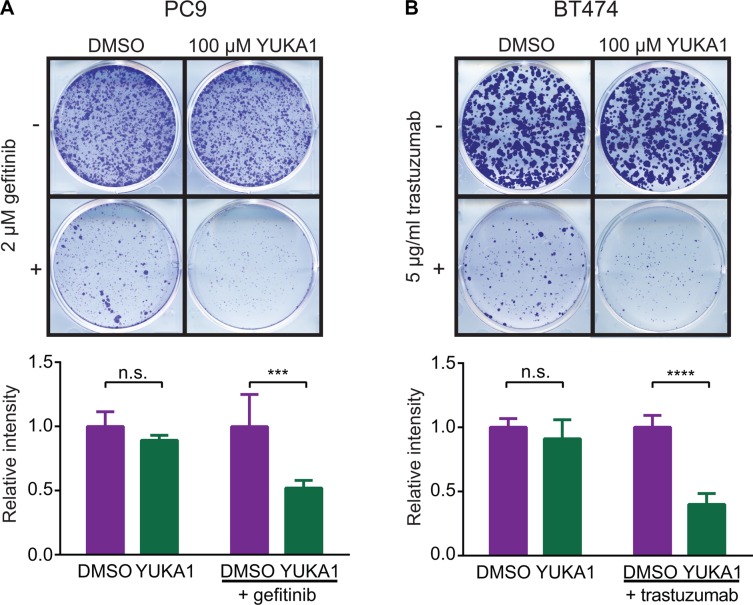
Figure 6. Effect of YUKA1 on anti-cancer drug resistance.
(A) Colony formation assays of PC9 cells treated with DMSO or YUKA1 for 7 days (top wells), or treated with 2 μM gefitinib plus DMSO or YUKA1 for 35 days (bottom wells). (B) Colony formation assays of BT474 cells treated with DMSO or YUKA1 for 35 days (top wells), or treated with 5 μg/mL trastuzumab plus DMSO or YUKA1 for 42 days (bottom wells). Representative wells are shown in the top panel and quantification from three independent experiments performed in triplicate is shown in the bottom panel. Asterisks indicate significance by unpaired t test (***p = 0.0002; ****p < 0.0001). Bars indicate mean ± SD. Relative intensity is the measured intensity value divided by the average value of DMSO-treated wells.

