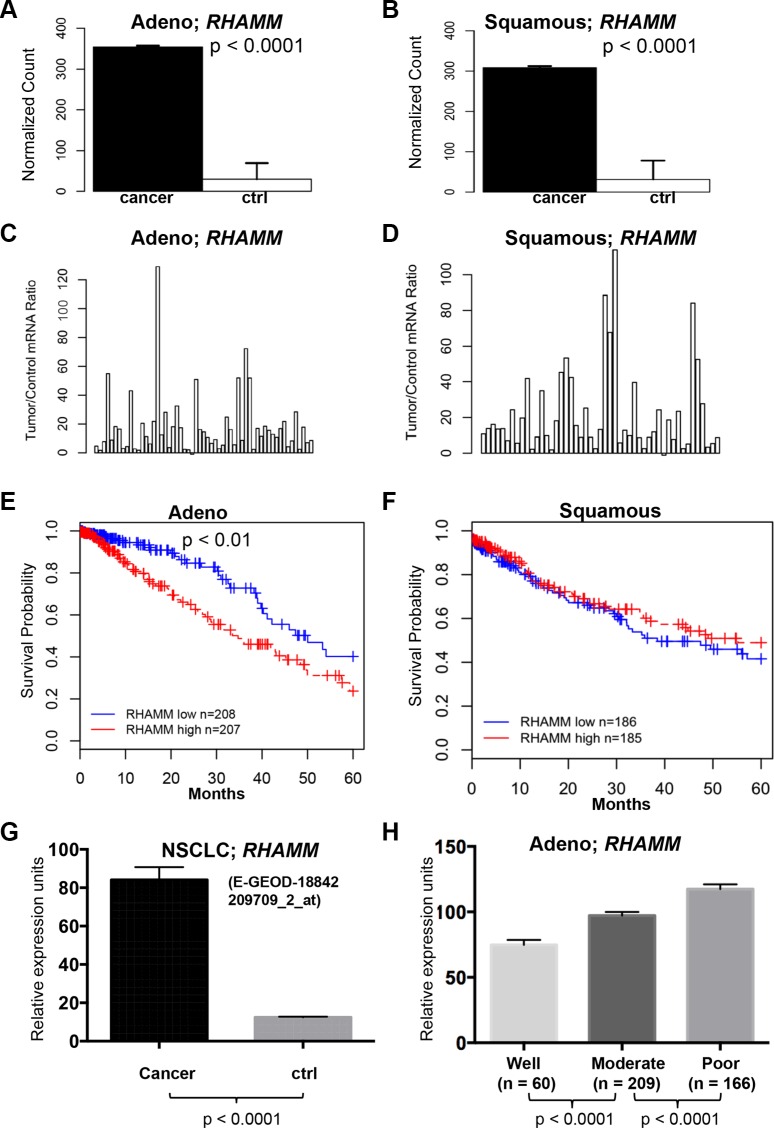
Figure 2. RHAMM gene expression is upregulated in lung adenocarcinomas compared to the patient-matched normal tissues and is associated with poor prognosis from TCGA datasets.
(A–D) The means and ratios of RHAMM RNA-Seq version 2 values from individual paired control to lung adenocarcinoma (A and C) and squamous cell carcinoma (B and D) of TCGA dataset are plotted. (E) Upregulation of RHAMM is associated with poor prognosis of the TCGA cohort with 415 lung adenocarcinomas. (F) Upregulation of RHAMM is not associated with poor prognosis of the TCGA cohort with 371 squamous cell carcinomas. High and low in the Figure legend represent the status of the RHAMM mRNA expression level compared to the median of the expression. (G) RHAMM is upregulated in NSCLC (ArrayExpress dataset E-GEOD-18842, [28]). The means and standard errors of RHAMM expression values from NSCLC (n = 46) and controls (n = 45) are plotted for comparison. The original log2 values from dataset are transformed into regular numeric values. Probe identification for RHAMM detection is 209709_s_at. (H) RHAMM gene expression in lung adenocarcinoma with various differentiated stages. Analysis of the Director's Challenge cohort dataset of 435 human lung adenocarcinoma cases that were well, moderately, or poorly differentiated. The graph represents the means and standard errors of cases in each differentiation category. The original log2 values from dataset are transformed into regular numeric values. Probe identification for RHAMM in Affymetrix microarray platform is 209709_s_at.

