
Figure 2. Higher methylation intensity of PTEN CpG islands in NPC specimens with EBV infection.
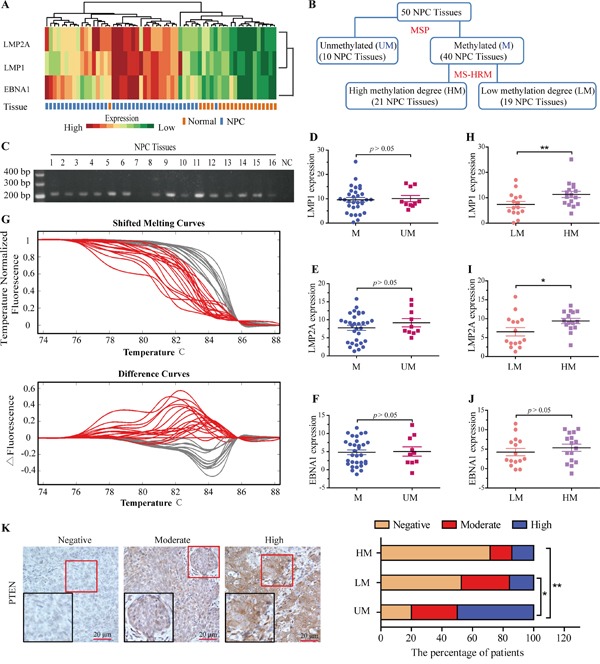
A. Hierarchical clustering of the EBNA1, LMP2A, LMP1 expression levels was generated by R programming language based on quantitative PCR results in NPC and NP samples. High and low expressed genes are shown by red and green, respectively. B. NPC tissues were divided into methylated (M) and unmethylated (UM) groups based on the MSP analysis results, and then the methylated group was subdivided into the high methylation intensity (HM) and low methylation intensity (LM) groups based on the MS-HRM analysis. C. Detection of methylation status of PTEN in NPC samples. D-F. Average expression levels of LMP1, LMP2A and EBNA1 in M and UM groups based on MSP analysis. G. MS-HRM results of the 40 methylated NPC tissues. Melting curves of the methylated NPC tissues as well as the corresponding difference curves are shown. The grouping is as calculated by the LightScanner software. H-J. Average expression levels of LMP1, LMP2A and EBNA1 in HM and LM group. mRNA abundance was normalized to GAPDH mRNA. K. Immunohistochemistry detection of PTEN protein in patients with NPC. Left, representative IHC of NPC samples, showing the negative, moderate and high expression level of PTEN, respectively. Right, the percentage of patients with the negative, moderate and high expression of PTEN protein in UM, LM and HM groups. Each bar represents the means ± SD of three experiments. *p<0.05, **p<0.01.