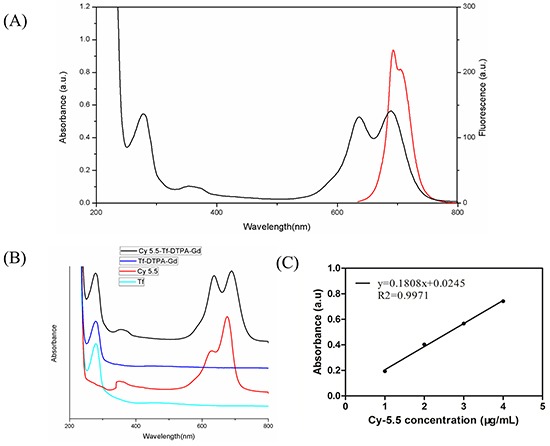
Figure 1. Characterization of probe.

A. UV-vis adsorption and fluorescence spectra of the probe. Emission curve (red line). Excitation curve (black line). B. The absorbance of Cy5.5 (red), Tf (green), Tf-DTPA-Gd (blue) and Cy5.5-Tf-DTPA-Gd (black), confirming the successful immobilization of Cy5.5-NHS on the surface of transferrin. C. The absorbance standard curve of Cy5.5-NHS is to quantify the coupling ratio of Cy5.5 per transferrin molecule.
