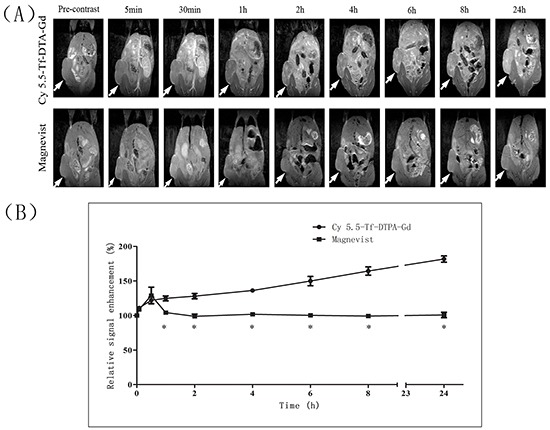
Figure 5. MR imaging of mice with subcutaneous H1299 cell xenografts.

A. T1-weighted MR images of nude mice at various time points following the i.v. injection of Cy5.5-Tf-DTPA-Gd (upper row), and Magnevist (lower row). The local hyperintensity was visualized using a 7.0 T small-animal MR. White arrows show location of subcutaneous H1299 cell xenografts. B. Quantitative analysis of MR images. The average MR relative signal enhancement was measured for each tumor. *p<0.05.
