
Figure 1. Tspan5 was downregulated in GC and correlated with clinicopathological features and patient overall survival.
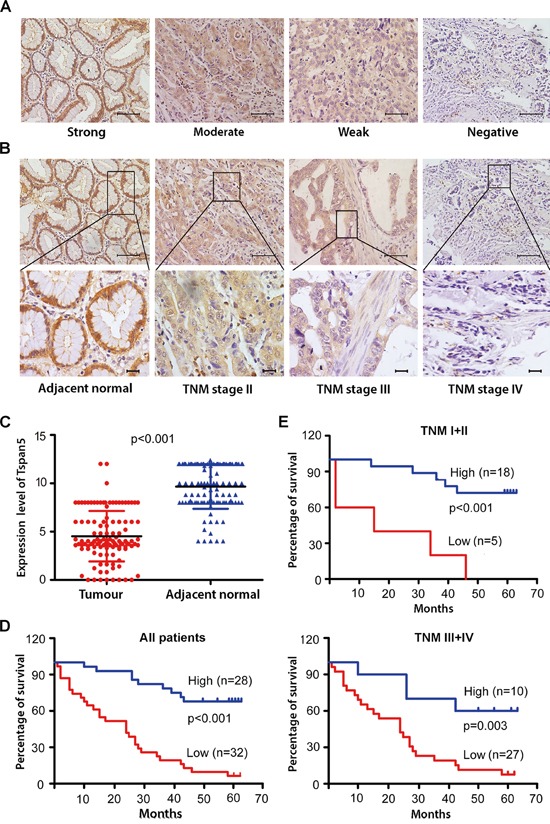
A. IHC analysis of Tspan5 expression in 114 pairs of tumour tissues and adjacent non-tumour tissues. Representatives of Tspan5 staining intensity: (i) Strong in adjacent tissue, (ii) moderate in tumour tissue, (iii) weak in tumour tissue, and (iv) negative in tumour tissue. 200× magnifications, scale bar 40μm. B. The expression of Tspan5 was associated with GC staging. (i) Strong in adjacent normal tissue, (ii) moderate in TNM stage II, (iii) weak in TNM stage III, and (iv) negative in TNM stage IV. Upper panels: 200× magnifications, scale bar 40μm.; lower panels: 400× magnifications, scale bar 20μm. C. The expression of Tspan5 in 114 pairs of GC was significantly higher in tumour tissues than that of adjacent normal tissues (4.51±2.61 versus 9.66±2.30, Student's t-test, ***P<0.001). D. The expression of Tspan5 was inversely correlated with overall survival of all 60 GC patients (***P<0.001) as revealed by Kaplan–Meier analysis. E. The expression of Tspan5 was inversely correlated with overall survival of 23 patients with TNM stage I+II group (***P<0.001) or that of 37 patients with TNM stage III+IV group (**P<0.01) as shown by Kaplan–Meier analysis.