
Figure 4. Tspan5 regulated cell cycle transition from G1-S phase by increasing p15/p27 and decreasing cyclin D1/CDK4/pRB/E2F1.
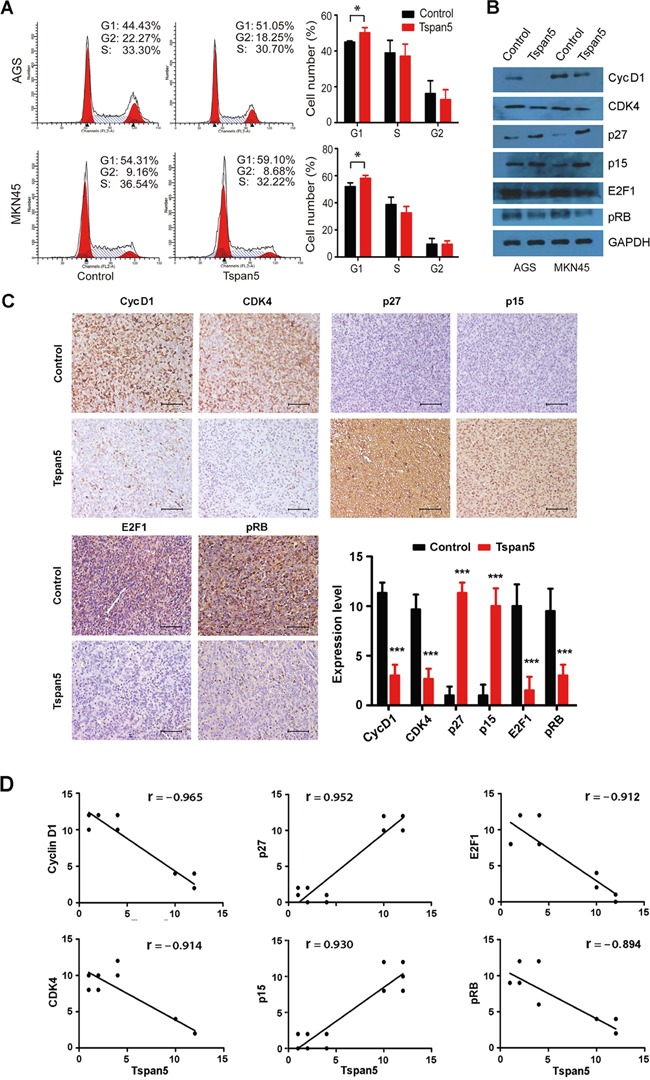
A. Flow-cytometry analysis of the cell cycle progression showing an increase of the percentage of cells in G0/G1 phase of Tspan5-overexpressing GC compared to that of control cells in both AGS and MKN45 cell lines (Student's t-test, *P<0.05). B. Western blotting showing the alternation of the expression of cyclin D1, CDK4, p27, p15, E2F1 and pRB in both AGS and MKN45 cell lines by Tspan5. C. IHC staining showing the increased expression of p27 and p15 and the decreased expression of cyclin D1, CDK4, E2F1 and pRB in Tspan5-overexpressing tumours versus control tumours (Student's t-test, N=6, ***P<0.001). 200× magnifications, scale bar 40μm. D. Pearson correlation analysis for the correlation of Tspan5 expression with the expression of cyclin D1, CDK4, p27, p15, E2F1 or pRB in xenografted tumours (N=12, all ***P<0.001).