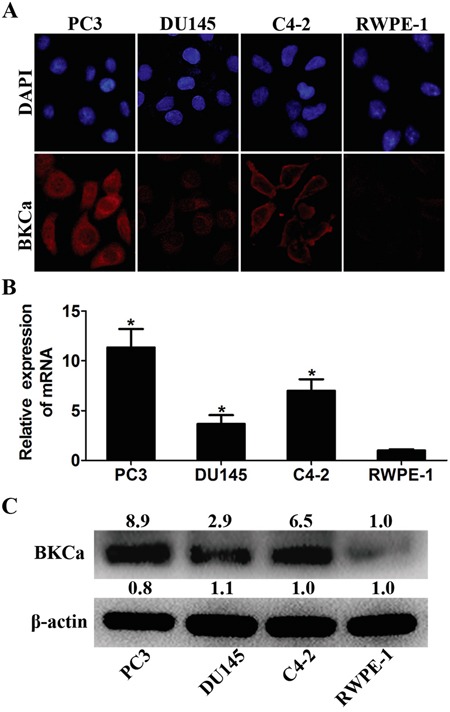
Figure 1. Expression analysis of BKCa in prostate cell lines.

A. Immunofluorescence staining of BKCa in cancerous prostate PC3, LNCaP and DU145 cells and normal prostate RWPE-1 cells. B. Real-time PCR analysis of BKCa mRNA in prostate cell lines. β-actin was used as internal control. The values were normalized to that of RWPE-1. C. Western blotting analysis of BKCa protein in prostate cell lines. β-actin was used as internal control and the values were normalized to that of RWPE-1. *P < 0.05.
