
Figure 2. Relationship between BKCa and Ki67 expression in human prostate cancer samples.
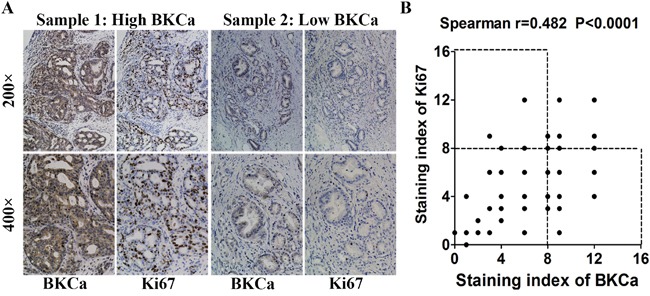
A. Immunohistochemical (IHC) staining of BKCa and Ki67 in prostate cancer specimens. B. Correlation analysis of BKCa and Ki67 expression. Staining index ranges from 0 to 12. Each point represents one prostate cancer specimen.