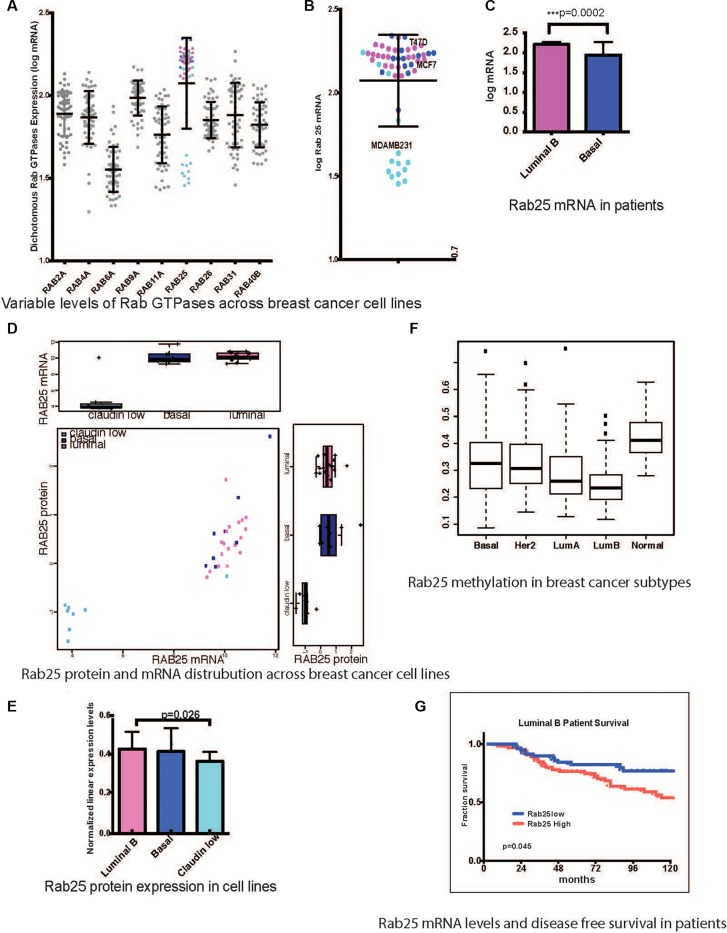
Figure 1. Rab25 expression is a clinical marker in breast cancer patients.
(A) mRNA levels of 9 Rab GTPases with more than 2fold range of expression across 54 breast cancer cell lines. The pink circles represent Rab25mRNA expression (log) in luminal B cell lines and light blue represents claudin low cell lines while dark blue represents basal lines. (B) Enlarged view of only Rab25 mRNA distribution with specific annotation of cells lines used subsequently. (C) Comparison of Rab25 mRNA levels between luminal B (135 tumors) and basal (71 tumors) in patients stratified based on PAM50. (D) Comparison of Rab25 mRNA and protein expression across breast cancer cells lines. (E) Graphical representation of absolute levels of Rab25 protein expression as measured by RPPA shows significant difference in between luminal B and claudin low groups. (F) TCGA breast cancer patient data showing different degree of methylation of Rab25 suggesting an epigenetic regulation of Rab25 gene expression. The box plot whiskers extend to 1.5 times interquartile range. The outliers in each group are shown as discrete data points. (G) Luminal B breast tumors are evaluated for Rab25 mRNA levels and correlated with disease free survival over 10 years (120 months). The red line shows patients with high Rab25 and blue shows patients with low Rab25.

