
Figure 2. The MtDP PC3 cells are mtDNA depletion, pyruvate and uridine auxotrophic and slow cycling.
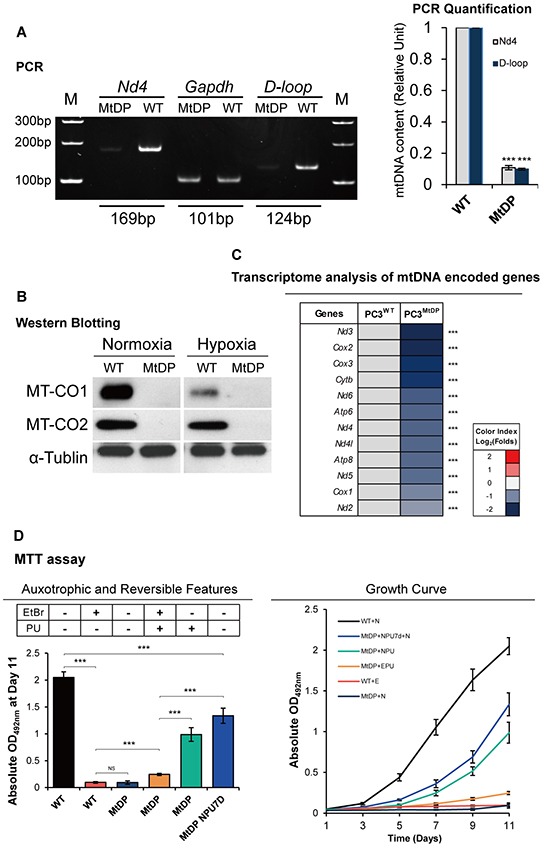
A. Representative PCR result of the Nd4 and D-loop mtDNA sequences with nuclear encoded gene Gapdh as control is shown on the left, and the amplification of mtDNA regions in the MtDP PC3 cells relative to the WT PC3 cells was calculated upon normalization to the reference Gapdh (right). The data are presented as means ± S.D (n=3). B. Protein levels of mtDNA encoded MT-CO1 and MT-CO2 were evaluated by western blotting of total protein extracts using anti MT-CO1 and MT-CO2 antibodies, α-tubulin signal was used as loading control. C. Transcriptome analysis of mitochondrial encoded genes in WT and MtDP PC3 cells. A color-coded index bar indicates the ratios. (FPKM value, Log2 (MtDP/WT)). D. MTT assay results. WT and MtDP PC3 cells were maintained in variable cell culture media with different gradients of EtBr and P (pyruvate) and U (uridine) presence (+) or not (−). The abbreviations are of followings: N: EtBr-/PU-; NPU: EtBr-/PU+; E: EtBr+/PU-; EPU: EtBr+/PU+. MtDP+NPU7d+N means MtDP PC3 cells were pretreated in NPU medium for 7 days before MTT assay, and then maintained in N medium in the experiment. The data are presented as means ± S.D (n=3). Statistical significance: *p<0.05, **p<0.01, ***p<0.001.