
Figure 3. MtDP PC3 cells show immature mitochondria.
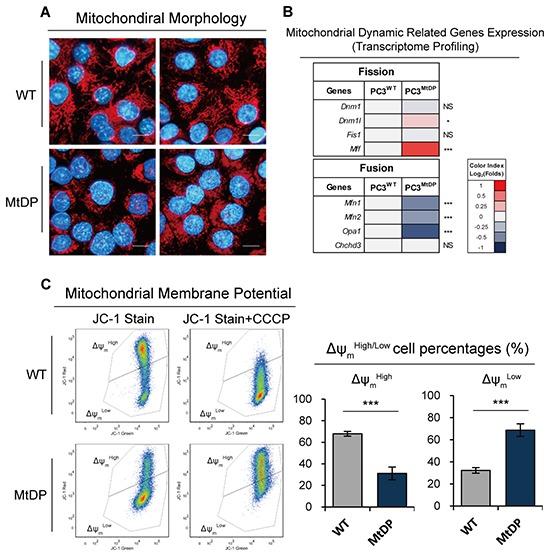
A. WT and MtDP PC3 cells were stained with MitoTracker® Red FM (mitochondria, red) and Hoechst33342 (nuclei, blue). Representative two images from independent tests are displayed for WT and MtDP PC3. Scale bar= 20μm. B. Transcriptome analysis of mitochondrial dynamic related genes in WT and MtDP PC3 cells. A color-coded index bar indicates the ratios. (FPKM value, Log2 (MtDP/WT)). C. Evaluation of Δψm in WT and MtDP PC3 cells determined by Δψm-sensitive JC-1 dye staining and flow cytometry. Pretreatment with 2μM CCCP was used as staining control. The percentages of cells with capacity to form JC-1 aggregates (ΔψmHigh) and JC-1 monomer (ΔψmLow) were determined in each group (the histograms). The data are presented as means ± S.D (n=3).