
Figure 4. MtDP PC3 cells exhibit Warburg effect.
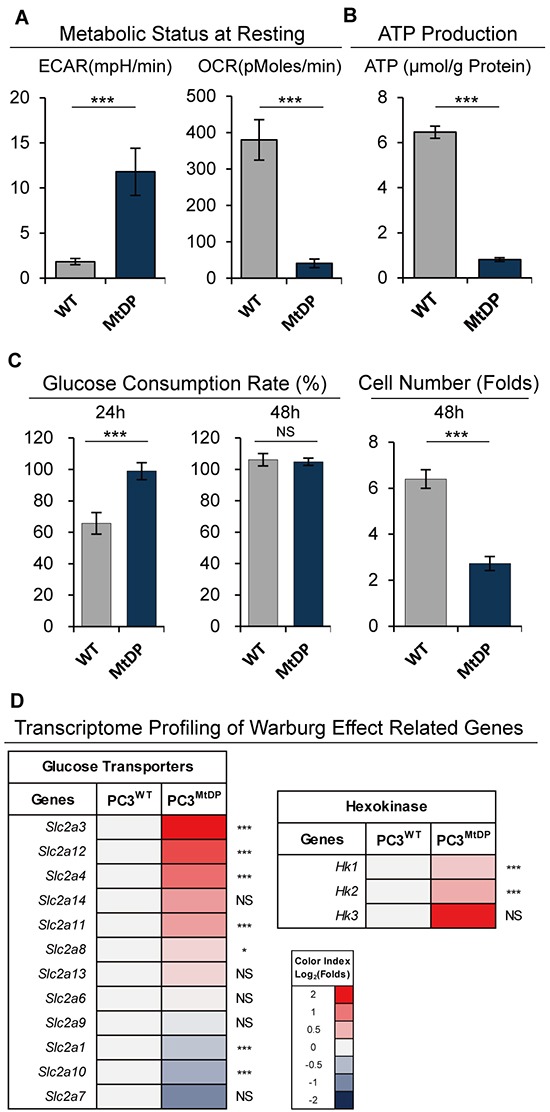
A. ECAR and OCR values measured under resting circumstance in WT and MtDP PC3 cells. The data are presented as mean ± S.D (n=3). B. The ATP content in WT and MtDP PC3 cells was determined by using centrifuged supernatant of total cell lysis. The measured ATP concentration was normalized by total protein concentration in each sample. The data are presented as means ± S.D (n=4). C. Glucose concentration was determined in cell culture medium of each group as described in material and methods. Fresh medium was used as control for glucose consumption ratio calculation. The data are presented as means ± S.D (n=3). The cell numbers were counted and amplification folds are showing on the right (final/start). D. Transcriptome analysis of hexokinase and glucose transporter family genes in WT and MtDP PC3 cells. A color-coded index bar indicates the ratio. (FPKM value, Log2 (MtDP/WT)). Statistical significance: *p<0.05, **p<0.01, ***p<0.001.