
Figure 5. The flowcytometric CD44, CD44/Δψm co-analyses and transwell experiment results.
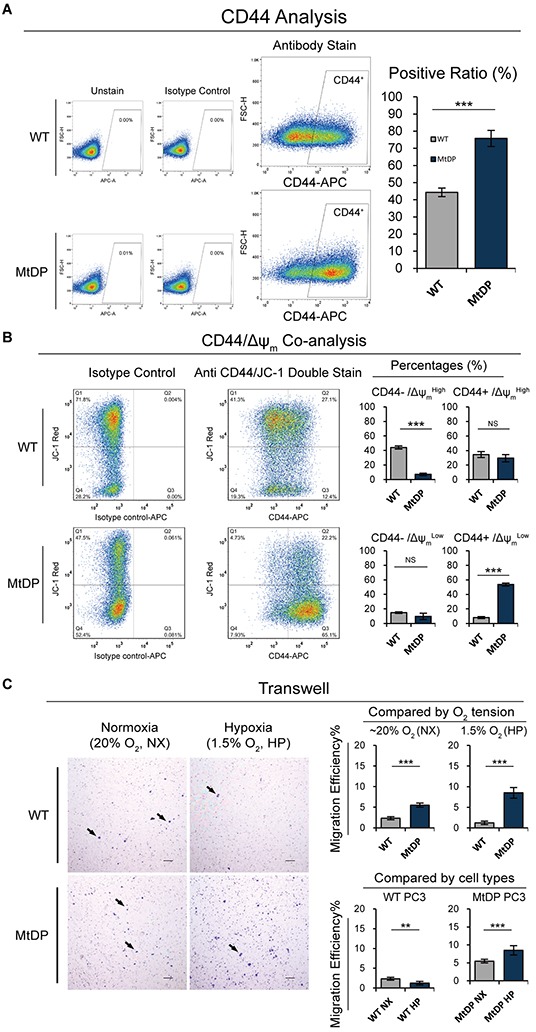
A. The CD44 expression level was assessed by flow cytometry for each group. The WT and MtDP PC3 cells were stained with a fluorophores conjunct CD44 antibody. The unstained and isotype control staining samples were used to confirm positive signal (left). Data are plotted in the right histogram, and data are presented as means ± S.D (n=3). B. Δψm and CD44 expression levels were co-analyzed by flow cytometry. The WT and MtDP PC3 cells were double stained with Δψm-sensitive JC-1 dye (JC-1 aggregates, axis Y) and fluorophore conjuncted CD44 antibody (axis X). The staining of isotype control antibody was used to confirm CD44 positive events and the JC-1 staining was used to verify the Δψm condition in cells (left). The data of four different combinations with CD44+/− and ΔψmHigh/Low are plotted on the right histograms. Data are expressed as mean ± S.D (n=5). C. Cell migration capacity under normoxic and hypoxic circumstances were assessed by transwell assay. Black arrows point to the cells penetrated through polycarbonate membrane (left). The migrated cells were counted and the data are displayed in charts on the right, and the data present as mean ± S.D (n=3). Scale bar = 100μm. Statistical significance: *p<0.05, **p<0.01, ***p<0.001.