
Figure 6. PC3 MtDP cells exhibit therapeutic resistance.
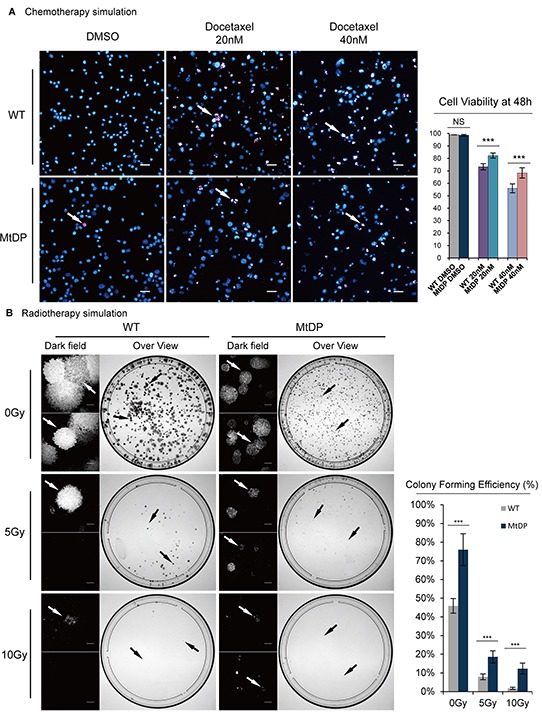
A. Both WT and MtDP PC3 cells were treated with 0nM (untreated, with equal volume DMSO), 20nM and 40nM docetaxel for 48h, respectively, and then the cells were stained with 5μg/ml PI and Hoechst33342 and visualized under fluorescent microscopy. The viable cells are only shown in blue (normal nuclei morphology) and dead cells are shown in a range of pink to white color (fragmented nucleus). Arrows point to representative dead/apoptotic cells. Scale bar = 50μm. Cell viabilities are showing in the histograms on the right. Data are presented by mean ± S.D (n=3). B. Representative images of irradiation examinations are showing on the left. 0Gy, 5Gy and 10Gy X-ray irradiations were given to WT and MtDP PC3 cells respectively, before the cells were incubated for modified colony formation assay for 16 days. Then, the cells were fixed and stained with 0.1% (w/v) crystal violet. The cell colonies were counted in a G: BOX multifunction imaging instrument (indicate by black arrow). For those dishes where the cells were irradiated at 5Gy and 10Gy, cell or small colony counting was performed under a dark field microscopy. Scale bar = 300μm. Showing on the right, histogram shows colonies/singular cells counted for both groups. The data are presented as means ± S.D (n=3). Statistical significance: *p<0.05, **p<0.01, ***p<0.001.