
Figure 7. MtDP PC3 cells exhibit enhanced cancer stemness features.
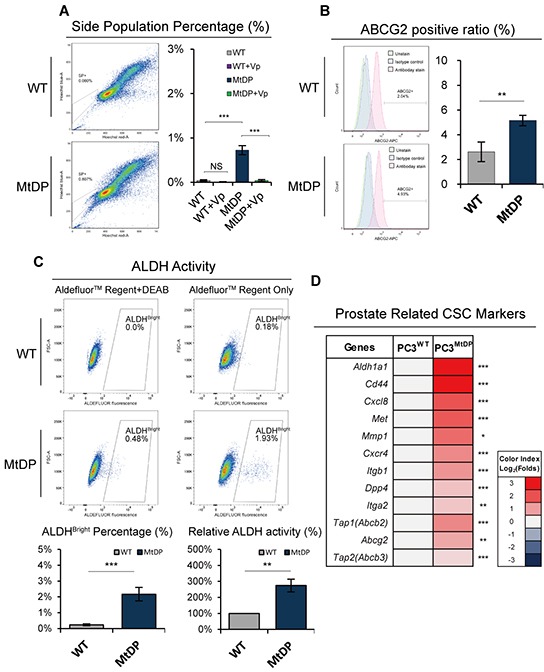
A. The SP cells in WT and MtDP PC3 cells were identified by flow cytometry with the Hoechst33342 based staining procedure. The SP cells displayed in plots show a tail-like sub-population close to the G0/G1 phase (on the left). Error bars stand for mean ± S.D (n=4) (on the right). B. ABCG2 expression level in WT and MtDP PC3 cells was assessed by flow cytometry with fluorophore conjuncted ABCG2 antibody. Representative flow cytometry figures are shown on the left. Histogram of the ABCG2 expression is shown on the right. The data are presented as means ± S.D (n=3). C. ALDH enzyme activity of WT and MtDP PC3 cells were evaluated by flow cytometry with a commercial ALDEFLUOR™ kit as described in material and methods. Represent images are shown on the upper part. The ALDHbright cell proportions and relative ALDH activity (fluorescent intensity) are shown in lower part as histograms. Four independent experiments were carried out. Error bars stand for mean ± S.D (n=3). D. Transcriptome analysis of prostate cancer stem cell-related genes in WT and MtDP PC3 cells. The ratios are indicated by color-coded index bars. (FPKM value, Log2 (MtDP/WT)). Statistical significance: *p<0.05, **p<0.01, ***p<0.001.