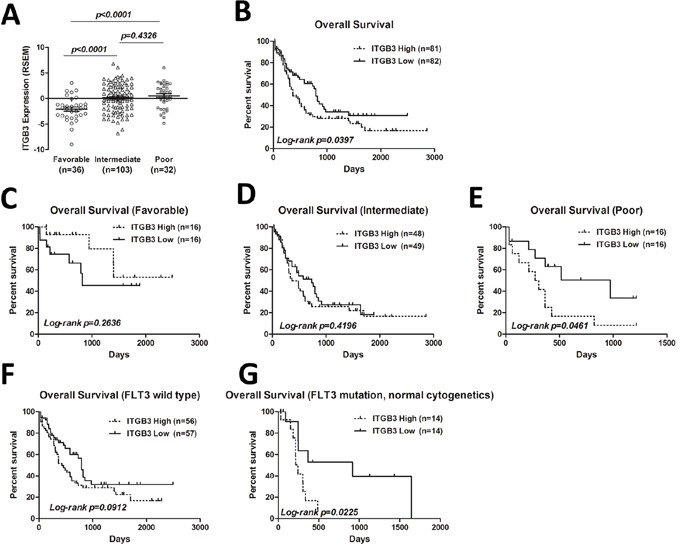
Figure 1. ITGB3 expression and correlation with overall survival (OS) in AML patients.

A. ITGB3 expression level in 171 AML patients from TCGA dataset (https://tcga-data.nci.nih.gov/tcga/) was grouped by cytogenetic risk according to NCCN. The expression level is represented by RSEM (RNA-Seq by Expectation Maximization) value. Unpaired Student's t-test was used to analyze the differences between groups. B. Kaplan-Meier plots of OS of all patients divided by ITGB3 expression. C-E. Kaplan-Meier plots of OS of AML patients segregated by ITGB3 expression in favorable, intermediate and poor groups, respectively. F-G. Kaplan-Meier plots of OS of AML patients segregated by ITGB3 expression in FLT3 wild type and FLT3 mutation groups, respectively.
