
Figure 5. Subgroup analysis of OS by high density of TAMs in different tumor distribution.
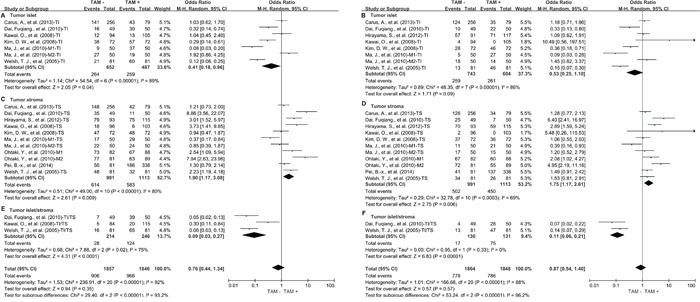
A. High density of TAMs in TI and 3-year OS; B. High density of TAMs in TI and 5-year OS; C. High density of TAMs in TS and 3-year OS; D. High density of TAMs in TS and 5-year OS; E. High value of TAMs in TI/TS and 3-year OS; F. High value of TAMs in TI/TS and 5-year OS. TI: tumor islet; TS: tumor stroma; M1: marker1; M2: marker2.