
Figure 1. Level of TREM-1 on tumor tissue-infiltrating monocytes/macrophages from patients with NSCLC.
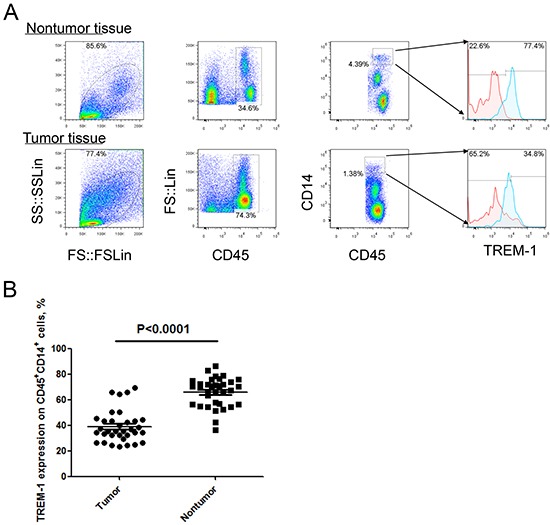
A. Representative dot plots and B. summarized data showed the levels of TREM-1 on monocytes/macrophages from the matched tumor and nontumor tissues from NSCLC patients (n=40). Red lines represent IgG control and blue lines represent anti-TREM-1 antibody. Student's t-test (paired test) was performed and data are presented as means±SEM.