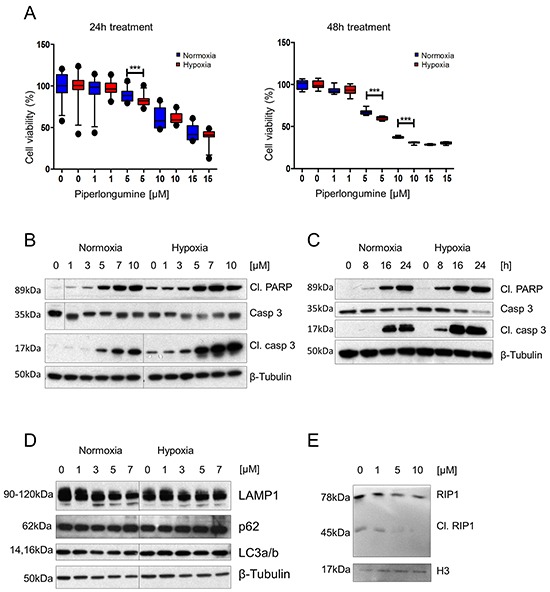
Figure 1. PL exhibits a cytotoxic effect on PHEO cell models via apoptotic and necroptotic pathways, and this effect is enhanced by hypoxia.

A. MPC cells were treated with 0, 1, 5, 10, and 15μM PL at 21% and 1% O2 for 24 and 48 hours. Cell viability was assessed by MTT assay. The box and whiskers graphs represent data from three independent experiments. B. MPC cells were treated with the indicated concentrations of PL at 21% and 1% O2 for 24 hours. Total cell lysates were subjected to Western blot with antibodies against cleaved PARP, cleaved caspase 3, and caspase 3. β-tubulin was used as a loading control. A representative image (n=3) is shown. C. Time course analysis of cleaved PARP, cleaved caspase 3, and caspase 3 in cell lysates from MPC cells treated with 10μM PL at 21% and 1% O2. β-tubulin was used as a loading control. A representative image (n=3) is shown. D. MPC cells were treated with indicated concentrations of PL at 21% and 1% O2 for 24 hours. Total cell lysates were analyzed by Western blot for p62, LAMP1 and LC3a/b. β-tubulin was used as a loading control. The representative image (n=3) is shown. E. MPC cells were treated with indicated concentrations of PL for 24 hours. Total cell lysates were analyzed by Western blot for cleaved RIP1. Histone 3 was used as a loading control. The representative image (n=3) is shown. ***P<0.001, Mann Whitney, U-test. Cl: cleaved. PL: piperlongumine.
