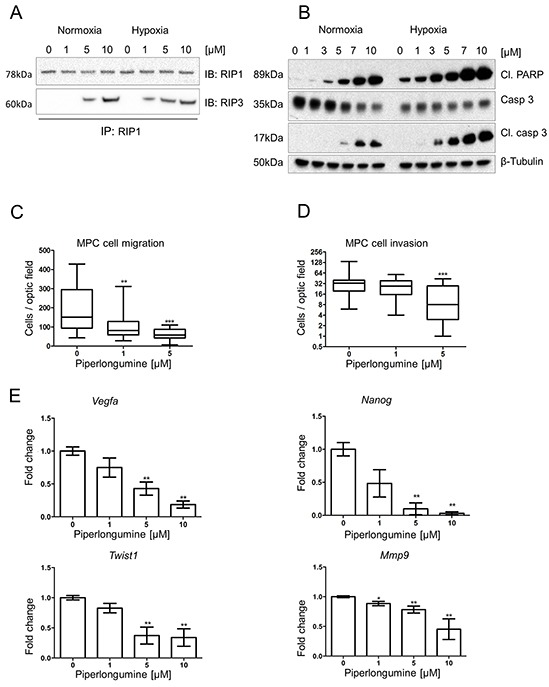
Figure 3. Piperlongumine activates apoptosis and necroptosis, and inhibits cell migration and invasion.

A. RIP1-IP was performed on cell lysates from MPC cells treated with the indicated concentrations of PL at 21% and 1% O2 for 24 hours and probed for RIP1 (top lane) and RIP3 (bottom lane). A representative image (n=3) is shown. B. MTT cells were treated with indicated concentrations of PL at 21% and 1% O2 for 24 hours. Total cell lysates were analyzed by Western blot for cleaved PARP, cleaved caspase 3 and caspase 3. β-tubulin was used as a loading control. The representative image (n=3) is shown. C. 1.5 × 10⁵ MPC cells were plated in the upper part of transwell chambers and allowed to migrate for 24 hours in the presence of 0, 1, and 5μM PL. The box and whiskers graph represents data from three independent experiments. D. 1.5 × 10⁵ MPC cells were plated in the upper part of matrigel-coated transwell chambers and allowed to migrate for 24 hours in the presence of 0, 1, and 5μM PL. The box and whiskers graph represents data from three independent experiments. E. MPC cells were treated with indicated concentrations of PL for 24 hours. mRNA expression levels of Twist1, Vegfa, Mmp9, and Nanog were assessed by quantitative real-time PCR. The target gene transcript levels were normalized to Actb. A graph represents data from three independent experiments as mean +/− SEM. *P<0.05; **P<0.01, ***P<0.001, Mann Whitney, U-test. Mmp9: matrix metallopeptidase 9; Cl: cleaved; PL: piperlongumine; IB: immunoblot; IP: immunoprecipitation.
