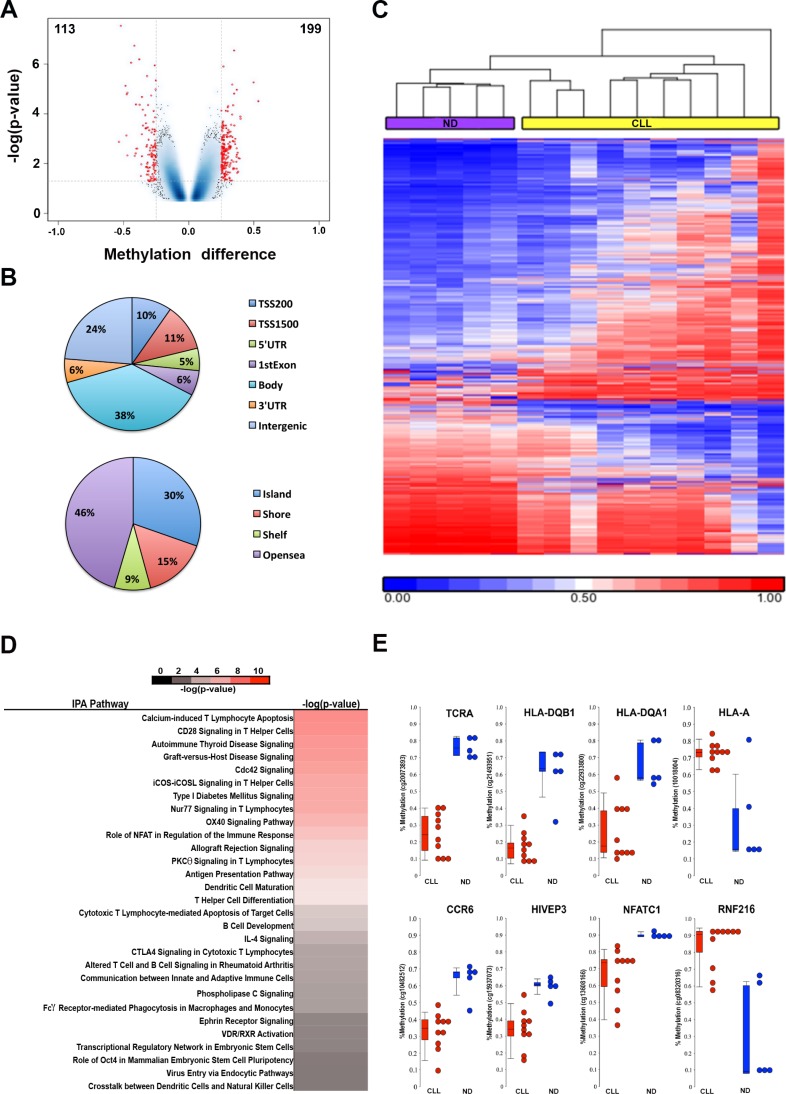
Figure 5. Genome-wide DNA methylation analysis identifies differentially methylated CpG sites in CD8+ T cells from CLL patient (n = 10) and ND (n = 5) samples.
(A) Volcano plot illustrates the 312 differentially methylated CpGs (DMCs) between CD8+ T cells from CLL and ND samples with 199 hypermethylated and 113 hypomethylated CpG sites that are associated with 206 genes. (B) Pie charts show distribution of DMCs among different annotation categories. (C) Heatmap shows a supervised cluster analysis of the 312 DMCs between CD8+T cells from CLL and ND samples. (D) Ingenuity Pathway Analysis revealed the enrichment of immune related pathways involved by 206 differentially methylated genes.(E) Representative DMCs associated with 8 genes related to immune function.

