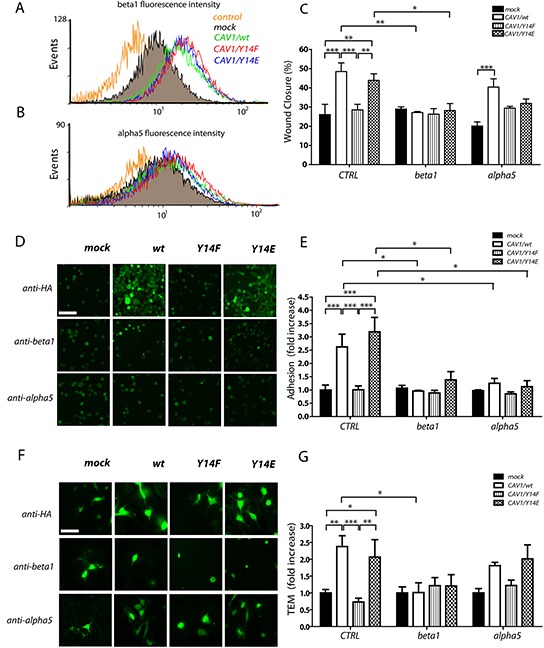
Figure 6. CAV1-enhanced wound closure and transendothelial migration require tyrosine 14 and beta1 surface expression in B16F10 cells.

B16F10(mock), (CAV1/wt), (CAV1/Y14F) and (CAV1/Y14E) cells were induced with 1mM IPTG for 48 h. Cells were then trypsinized, fixed and immunostained for beta1 and alpha5 integrins and analyzed by flow cytometry. A. Beta1 integrin fluorescence intensity. B. alpha5 integrin fluorescence intensity. C. Confluent monolayers of B16F10 cell lines were wounded with a pipette tip, incubated with anti-beta1 or anti-alpha5 integrin antibodies (5 μg) and images were recorded at 0 and 7 h post-wounding. As a control (CTRL), a non-related anti-GFP antibody was used. The wounded area was measured with the Adobe Photoshop software and the percentage (%) of wound closure in 7 h is plotted for the indicated condition. D. EA.hy926 cells (2,5 × 10⁵) were seeded on 24-well plates and impermeable cell monolayers were allowed to form for 72 h. B16F10(mock), (CAV1/wt), (CAV1/Y14F) and (CAV1/Y14E) cells (5×10⁴), previously stained with CellTracker green and incubated for 1 h with anti-HA (CTRL), anti-beta1 or anti-alpha5 integrin antibodies, were added to the EA.hy926 monolayer. Then, B16F10 cells were allowed to adhere to the EA.hy926 monolayer for 1 h (scale bar, 100 μm). E. The graph represents the average for adhesion (cells per field) following incubation of the B16F10 cells with the antibodies mentioned above. F. EA.hy926 cells (2,5 × 10⁵) were seeded on the Transwell inserts and impermeable cell monolayers were allowed to form for 72 h. B16F10 cell lines (5×10⁴), previously stained with CellTracker green and incubated for 1 h with the neutralizing antibodies using the same procedure described above, were added to the EAhy monolayer in the inserts. Then, B16F10 cells were allowed to penetrate the EA.hy926 monolayer for 6 h. B16F10 cells observed by epifluorescence microscopy with a 40X objective on the lower side of the Transwell membrane are shown (scale bar, 50 μm). G. Values in the graph represent the average of TEM (cells per field) following incubation of the in B16F10 cells with the different antibodies. Data were normalized to values obtained for control (mock) cells. Adhesion and TEM was quantified as cells per field from 10 different fields in three independent experiments (mean ± S.E.M, n=3, ***p<0.001; **p<0.01 and *p<0.05).
