
Figure 1. Cancer cells show typical Warburg effect.
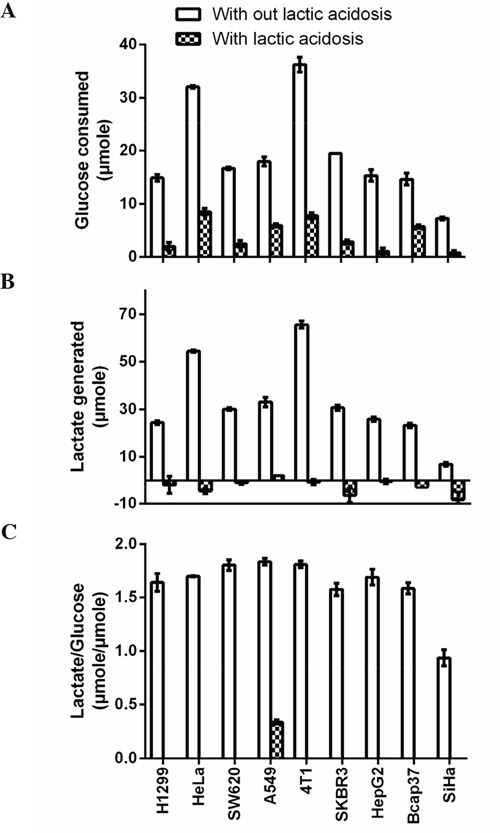
Cancer cells (1 × 10⁶) were cultured in complete RPMI-1640 with or without lactic acidosis for 24 hours and glucose consumption and lactate generation were measured. A. Glucose consumption. B. Lactate generation. C. Lactate generated over glucose consumed. One molecule of glucose, if completely converted to lactate, will generate 2 molecules of lactate. This ratio reflects how many percentage of incoming glucose is converted to lactate. Note that under lactic acidosis, except A549, lactate generation in other cell lines were negative, meaning these cancer cells consumed lactate in medium, hence there were no ratio (lactate generated/glucose consumed) for these cells. Data are mean ± SD. Results were repeated by 3 independent experiments.