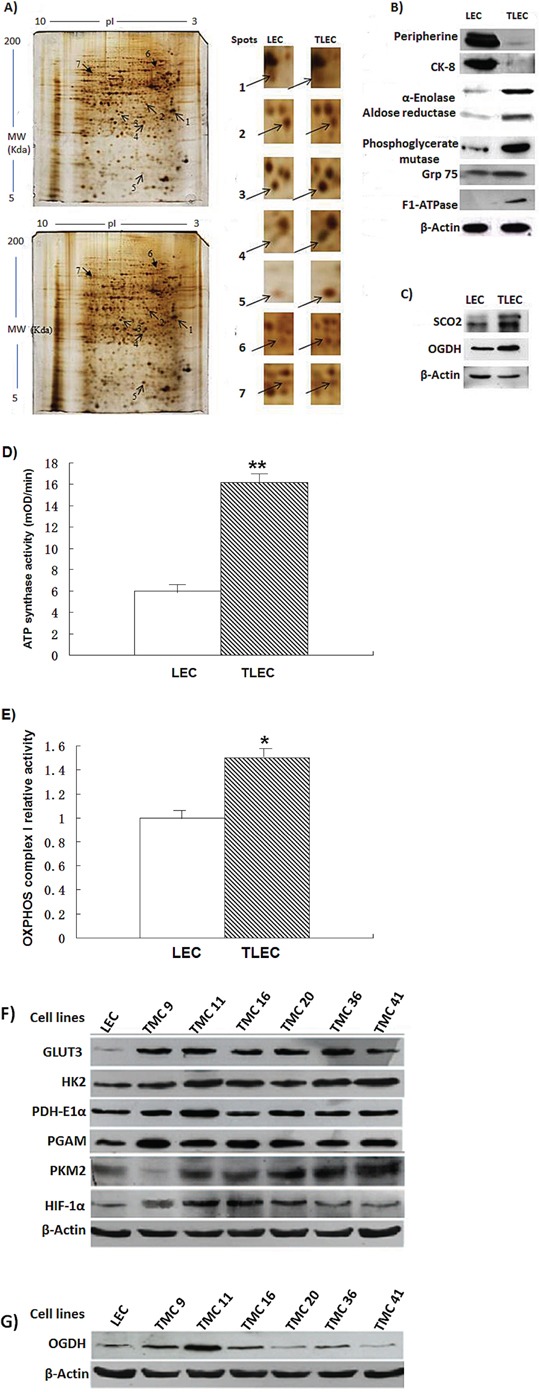
Figure 2. Representative protein gel images of parental LECs and transformed TLECs.

A. Protein pattern of control LECs (top) and TLECs (bottom) displayed by 2D gels (12.5%) and silver staining. Arrows identify the spots that were identified by MALDI-TOF mass spectrometry and listed in Table 1. B. Immunoblotting to validate the proteins identified by MALDI-TOF mass spectrometry. Total cellular proteins of LECs and TLECs were subjected to western blot analysis. After development, the membrane was stripped and re-probed with an actin monoclonal antibody to monitor the loading. C. Two enzymes in the OXPHOS pathway, SCO2 and OGDH, were determined by western blot analysis. Both SCO2 and OGDH were upregulated in TLECs. Results are representative of three independent experiments. D. and E. are enzymatic activities of ATP synthase and OXPHOS complex I in mitochondrial homogenates extracted from LECs or LECs, respectively. The amounts of protein from mitochondrial homogenate used for complex I was 20 μg and ATP synthase was 100 μg. Data are expressed as mean ± SD. P-value (Student's t-test) <0.05 was considered significant. F. and G. are immunoblots of glycolytic and OXPHOS enzymes in various transformed cell subclones (TMCs).
