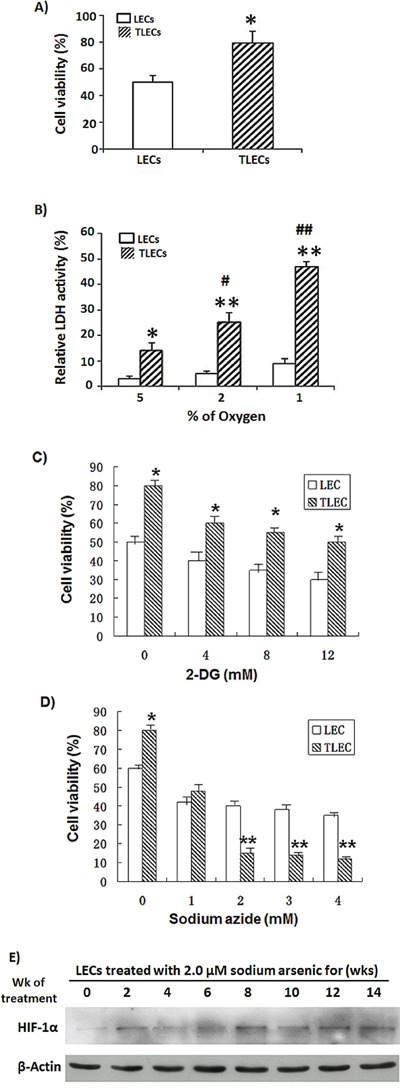
Figure 5. Effects of hypoxia on glycolysis and viability of TLECs.

A. LEC and TLEC cells were placed in a hypoxic incubator (under 2% oxygen) for 24 h. Cell viability was determined by NBB staining. TLECs were more adapted to hypoxic environment and showed higher cell viability than LECs. B. Both LEC and TLEC cells were incubated in various oxygen concentrations for 24 h, respectively, and glycolytic activity was determined by LDH assay. LDH activity is reflective of the level of anaerobic respiration. TLECs showed a higher LDH surge compared to parental LECs, indicating TLECs could rapidly induce glycolysis under hypoxia (*, p < 0.05 compared to LECs; **, p < 0.001 compared to LECs at the same oxygen percentage; #, p < 0.05 compared to TLECs when the oxygen percentage was set at 5%; ##, p < 0.001 compared to TLECs when the oxygen percentage was set at 5%). Both LEC and TLEC Cells were put in a hypoxic incubator (under 2% oxygen) for 24 h. Cell viability decreased as increasing concentrations of C. 2DG or D. sodium azide were added to cell culture medium for 24 h. TLECs showed signification cell death at concentrations of sodium azide higher than 2 mM. Cell viability was determined by NBB staining as described in the Materials and Methods section (*, p < 0.05 compared to LECs at the same concentration; **, p < 0.001 compared to LECs at the same concentration). E. Immunoblotting of HIF-1α in LEC cells at various time points during the transformation process. Total cellular proteins of LECs at various time points were subjected to western blot analysis with HIF-1α antibody. After development, the membrane was stripped and re-probed with an actin monoclonal antibody to monitor the loading difference.
