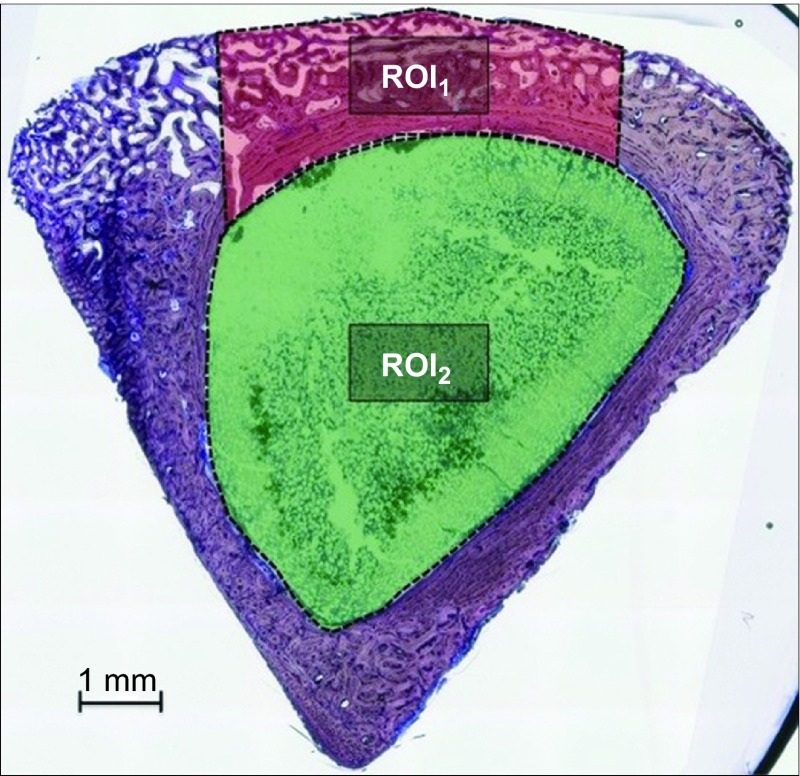
Figure 2.
ROI areas. Processed image showing the regions of interest at the cortex in red (ROI1) and at the marrow in green (ROI2). The CDC, NB, CT and RM were measured for each region. Toluidine blue staining, magnification ×5. CDC, cortical defect closure; CT, connective tissue or its space; NB, new bone; RM, residual material; ROI, region of interest.

