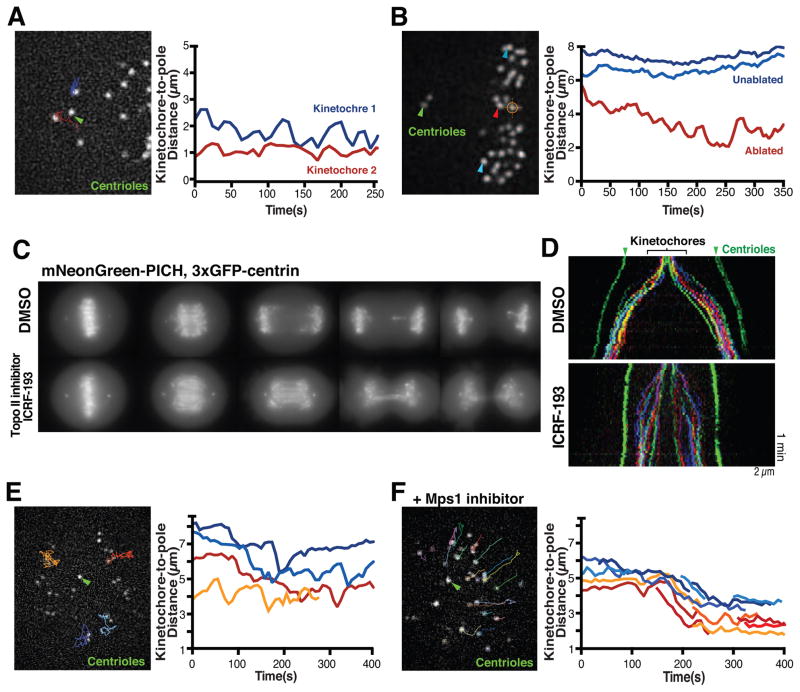
Figure 2. Physical connections between sister chromatids are not required for anti-poleward motion.
(A) Still image from a representative time-lapse movie of a HeLa cell (3xGFP-CENP-A, 3xGFP-centrin; n=20) following depletion of the cohesin subunit RAD21 (48 h) displaying tracks until current time point of selected kinetochores used to generate the kinetochore to spindle pole distance graph (right). (B) Image of a HeLa cell (3xGFP-CENP-A, 3xGFP-centrin) before laser ablation (orange hair cross) to inactivate one of 2 sister kinetochores (n=29 experiments). Arrowhead indicates the released kinetochore (red) or unaffected kinetochores (blue) which were tracked to generate spindle to pole distance graph (right). (C) Maximal intensity projections of still images from representative time-lapse sequences of HeLa cells expressing mNeonGreen-PICH, 3xGFP-centrin entering anaphase in presence of DMSO (n=10) or 1 μM of the topoisomerase inhibitor ICRF-133 (n=14). (D) Color-coded kymographs of HeLa cells (3xGFP-CENP-A, 3xGFP-centrin) from anaphase onwards treated with DMSO (n=5) or ICRF-193 (n=7). (E) Still image from a time-lapse movie of a HeLa cell (3xGFP-CENP-A, 3xGFP-centrin) treated with S-trityl-L-cysteine (STLC) to generate a monopolar spindle (n=11) showing tracks of the selected kinetochores used to generate kinetochore to spindle pole distance graph (right). (F) Image from time-lapse movie of a monopolar HeLa cell (3xGFP-CENP-A, 3xGFP-centrin) treated with STLC and the Mps1 inhibitor AZ3146 (n=8). Selected tracks were used to generate the kinetochore to spindle pole distance graph (right). Green arrowheads highlight spindle poles. t=0 is beginning of movie. Scale bars, 2 μm. See also Figure S2, Table S2 and Movie 2.

