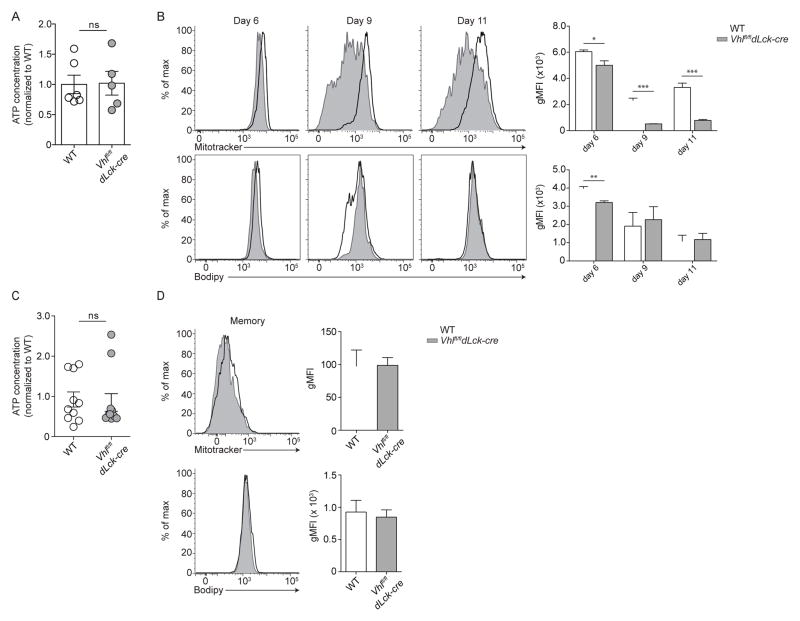
Figure 5. Glycolytic metabolism does not impair ATP production and compensates for suppressed oxidative phosphorylation.
(A,C) Cellular ATP extracted from WT and Vhlfl/fldLck-cre donor cells (per 104 cells) sorted from spleen and lymph nodes of individual host mice (A) post peak of CD8+ response and (C) >60 days following infection. Data are relative to average WT cell ATP levels. Cumulative data (n = 6 mice) from two independent experiments. (B,D) Representative flow cytometric analysis of total donor WT (open black histogram) or Vhlfl/fldLck-cre (filled grey histogram) cells for analysis of mitochondrial mass and free fatty acid levels at indicated time point following infection. Bar graphs show Mitotracker and Bodipy gMFI of indicated donor populations. (B, n = 3–4 mice per 2 independent experiments D, n = 3–5 mice per 3 independent experiments). Data in (A,C) show mean ± SEM with two-tailed Student’s t test, ns p > 0.5, * p < 0.05, ** p < 0.01, *** p <0.001.

