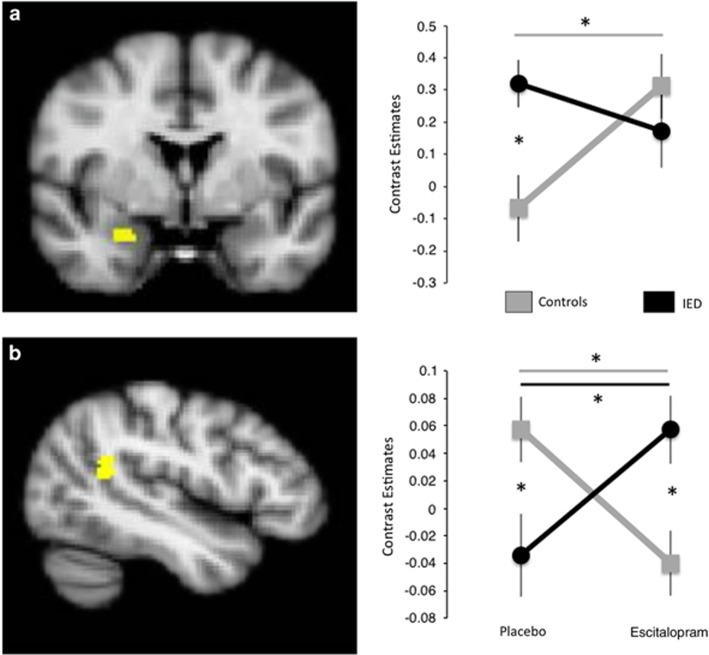
Figure 1.
Group × Drug interaction effects. (a) Right amygdala, small volume corrected. (b) Left temporal parietal junction. Error bars are SEM (radiological convention; left is right, right is left). *Post hoc pairwise t-test P<0.05 (between-group effect per drug condition, or within-group change because of drug condition).

