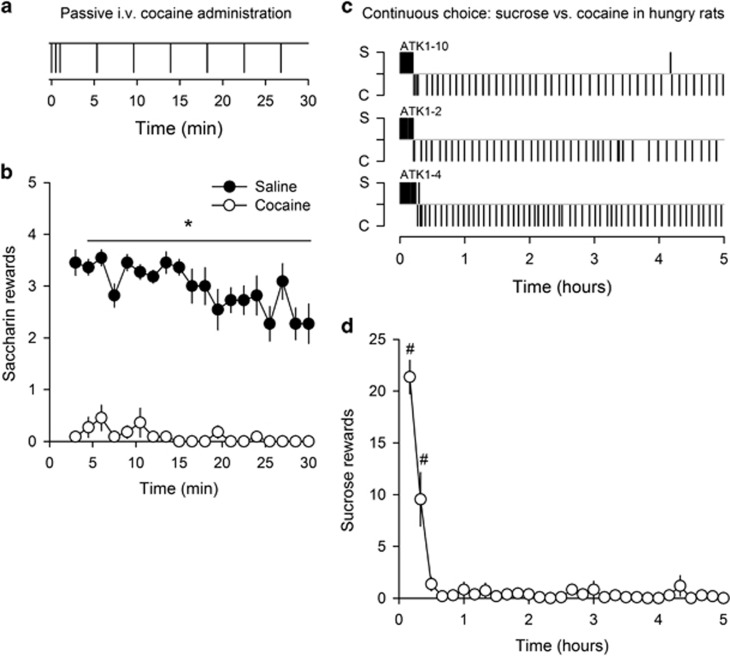
Figure 3.
Cocaine-induced suppression of responding for saccharin. (a) Temporal distribution of programmed, passive saline or cocaine (0.25 mg) administration. Each vertical bar represents a programmed injection. (b) Mean (±SEM) sweet rewards (0.2% of saccharin) during passive saline and cocaine administration. Lever C remains retracted throughout the 30-min session. *Different from cocaine (p<0.01, Wilcoxon test). (c) Within-session distribution of sweet (20% of sucrose) and cocaine (0.25 mg) rewards during a 5-h session of continuous choice in 3 representative food-restricted rats (ie, 80% of their free-feeding body weight adjusted for growth). Each alphanumeric code above each distribution corresponds to an individual rat (see legend of Figure 2 for other details). (d) Mean (±SEM) within-session time course of sucrose rewards during continuous access to cocaine for self-administration in food-restricted rats (n=11). #Different from 0 (p<0.05, t-test).

