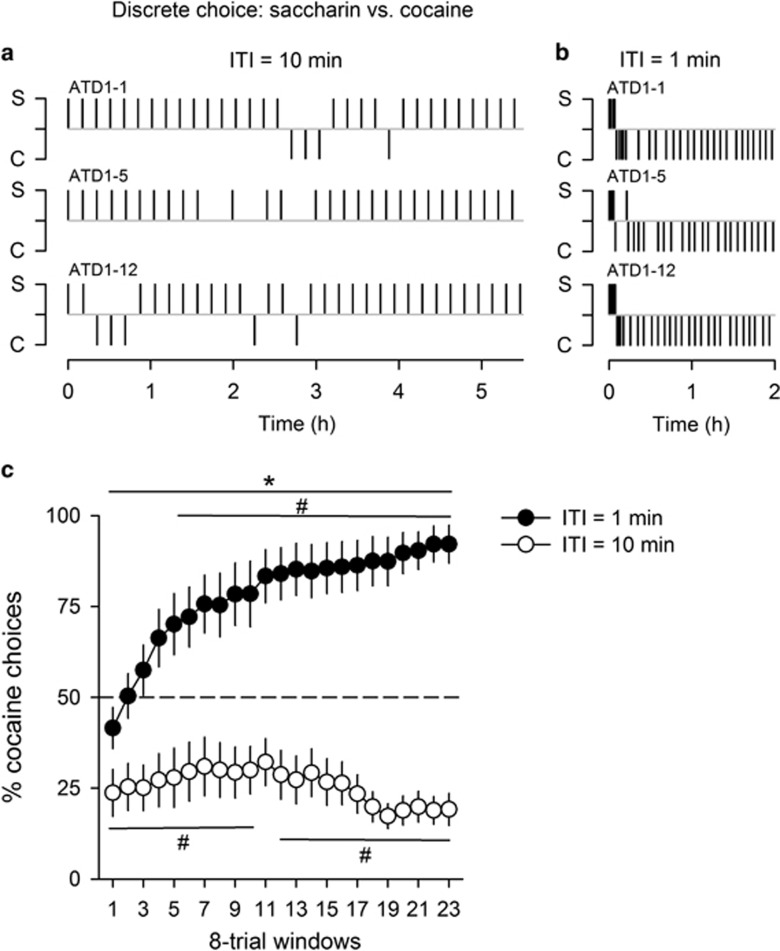
Figure 4.
Effects of the interchoice interval on choice outcomes in a discrete choice setting. Within-session distribution of saccharin (0.2%) and cocaine (0.25 mg) choices with an intertrial interval (ITI) of 10 min (a) or 1 min (b) in the same 3 representative rats. Each alphanumeric code above each distribution corresponds to an individual rat. (c) Mean (±SEM) percent cocaine choices within a session as a function of the interchoice interval (n=18). The within-session evolution of cocaine choices was computed for each individual rat using a sliding window of 8 consecutive choice trials (trials 1 to 8; trials 2 to 9; trials 3 to 10; and so on until trials 23 to 30). *Different from the 10 min intertrial interval (p<0.01, main effect, ANOVA with repeated measures); #different from the indifference level of 50% (p<0.05, t-test).

