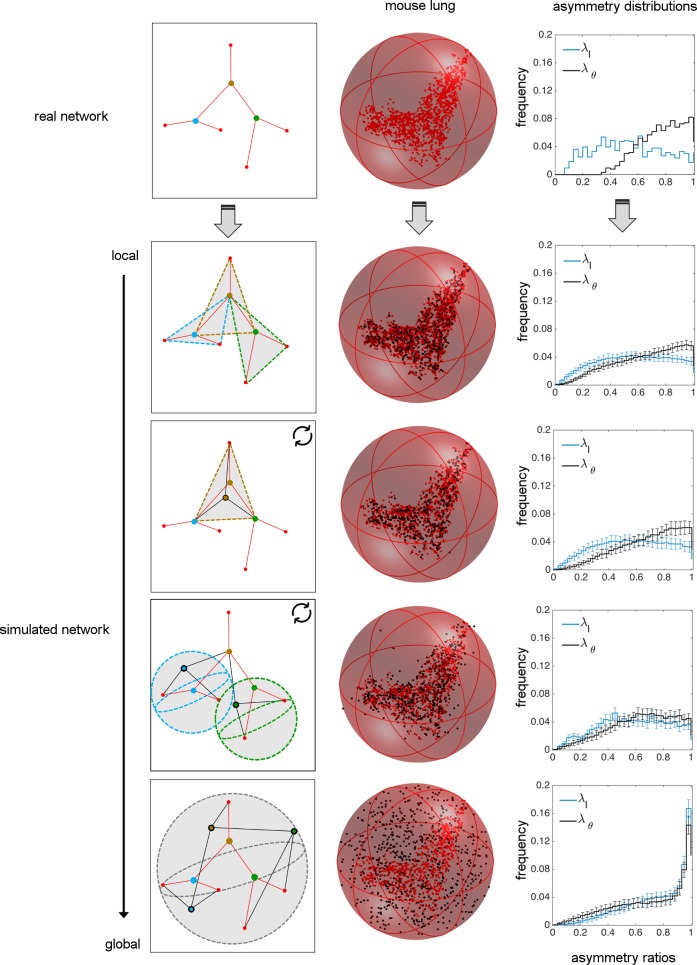
Fig 2. Comparison of real data for vascular networks versus random simulations of branching junctions.
The real and simulated networks (via local to global spatial constraints) are separated by different rows. A schematic small network is given to describe how different simulations are performed. The vessels and the fixed endpoints of the real branching network are represented in red. Vessels that result from random branching simulations are in black. The healthy mouse lung network and the simulated mouse lung networks are shown within a minimum spherical boundary that contains all branching data from the real network. Here, the red nodes for each figure correspond to the real data, whereas the black nodes correspond to the simulated data. Note that the terminal tips and the most upstream node (i.e., the source) are determined from real data and fixed throughout all simulations. The resulting asymmetry ratio distributions for length and branching angles are provided for the real network and for each of the simulations. The statistical comparisons of random branching simulations with empirical data are given in Table 1.

