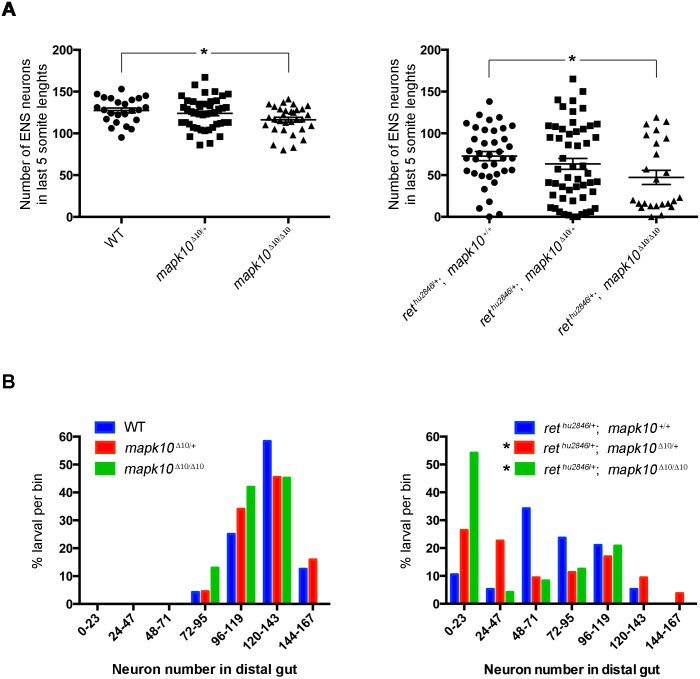
Fig 5. mapk10 as candidate to account for varying expressivity in HSCR.
(A) Enteric neuron number in the distal gut quantified in 4dpf larvae resulting from crosses between mapk10Δ10/+ and rethu2846/+;mapk10Δ10/+ zebrafish. No difference was detected between WT and heterozygous mapk10Δ10 larvae, but mapk10Δ10/Δ10 larvae have a small, but statistically significant reduction in ENS cell number in the gut relative to WT (one-way ANOVA, p = 0.0442, Tukey post-hoc), indicating a role for mapk10 in normal ENS development. No significant difference was detected between rethu2846/+ and mapk10Δ10/+;rethu2846/+ larvae, however, loss of mapk10 in the rethu2846/+ background leads to statistically significant reduction in neuron number (Welch’s one-way ANOVA, p = 0.048). (B) To examine phenotype distribution, individual zebrafish were binned according to neuron number in the distal gut. WT, mapk10Δ10/+ and mapk10Δ10/Δ10 larvae show normal distribution of phenotypes (blue, red, and green bars, respectively, Shapiro-Wilk normality test, for WT: p = 0.776, for mapk10Δ10/+: p = 0.910, and for mapk10Δ10/Δ10: p = 0.1149). Although rethu2846/+ larvae guts are phenotypic, they display a range of neuron numbers in the distal gut region, reflecting normal distribution of mild and progressively more severe colonization phenotypes (Shapiro-Wilk normality test, p = 0.5720, blue bars), counts of neuron number in rethu2846/+;mapk10Δ10/+ (red bars) and rethu2846/+;mapk10Δ10/Δ10 larval guts (green bars) exhibit a non-normal distribution pattern (Shapiro-Wilk normality test, for rethu2846/+;mapk10Δ10/+: p = 0.0054, and for rethu2846/+;mapk10Δ10/Δ10 p = 0.0014), and counts of enteric neuron number in rethu2846/+;mapk10Δ10/Δ10 larvae, showed a statistically significant increase in standard deviation compared with rethu2846/+ larvae (Brown-Forsythe, 0.0445).

