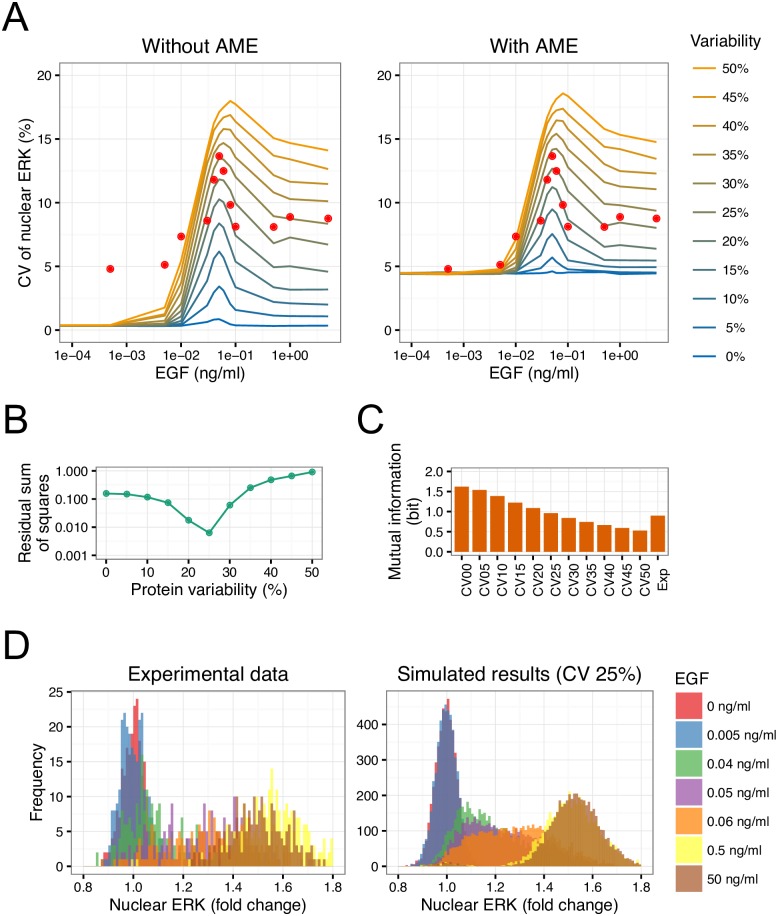
Fig 4. Direct comparison of simulation results with experimental data.
(A) CV of simulated nuclear ERK without/with AME are shown. Points represent experimental data [14]. (B) The residual sum of squares between simulation results with AME and experimental data. (C) Mutual information between EGF concentration and nuclear ERK was calculated from simulation results and experimental data [14]. (D) Distributions of nuclear ERK in simulation results at 25% CV of protein variability and experimental data [14].

