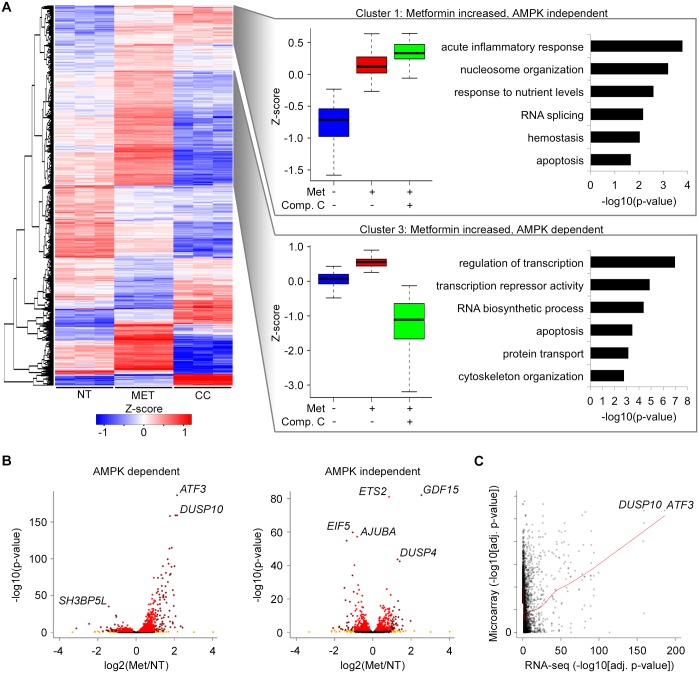
Fig 2. Gene expression profiling of human hepatocytes following treatment with metformin, metformin plus compound C or no treatment control.
(A) Gene-wise hierarchical clustering heatmap of 1,906 differentially expressed genes in response to metformin treatment (adjusted P ≤ 0.05) showing segregation into 10 groups. The z-score scale represents mean-subtracted regularized log-transformed read counts. Cluster 1 (n = 194) includes genes with increased expression in response to metformin that remain elevated when also treated with compound C (metformin increased, AMPK independent). Cluster 3 (n = 575) includes genes with increased expression in response to metformin that decrease in expression when also treated with compound C (metformin increased, AMPK dependent). Each box in the box plots is the interquartile range (IQR), the line is the median and the whiskers show the furthest data points from the median within 1.5 times the interquartile range. Enriched GO terms are shown to the right. (B) Volcano plot displaying fold change versus adjusted p-values of AMPK dependent (left) and AMPK independent (right) genes. (C) Comparison of adjusted p-values of genes differentially expressed in response to metformin between this study (RNA-seq, X-axis) and a previously reported microarray experiment (microarray, Y-axis).

