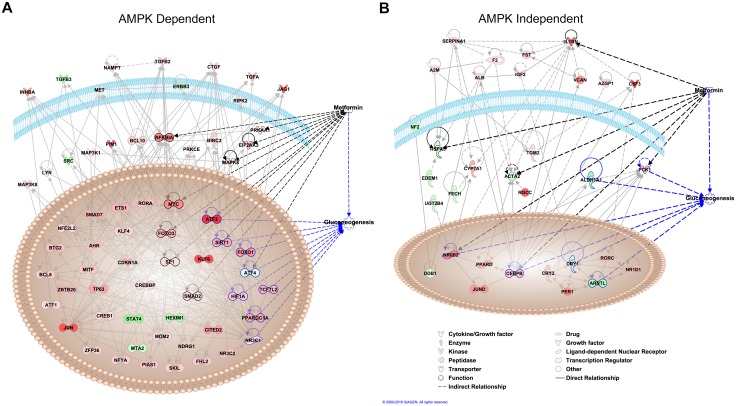
Fig 3. Upstream regulator analysis of RNA-seq data.
Transcription factors, kinases, growth factors and other molecules for the (A) AMPK-dependent and for the (B) AMPK-independent clusters of genes. Upregulated and downregulated genes as determined by RNA-seq are colored in red and green, respectively.

