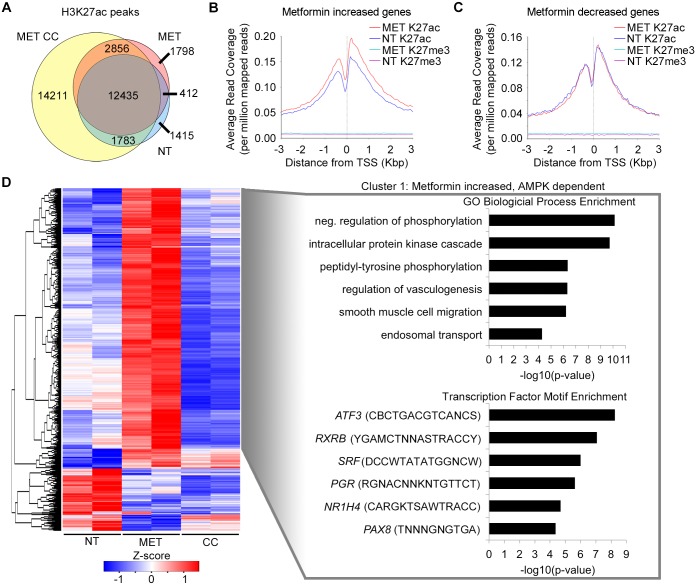
Fig 4. Genome-wide characterization of H3K27ac and H3K27me3 changes in human hepatocytes in response to treatment with metformin, metformin plus compound C or no treatment control.
(A) Venn diagram of H3K27ac peaks in common or unique between metformin treatment (red), no treatment (blue) or metformin plus compound C (yellow) conditions. Changes in histone modification at differentially expressed promoters for AMPK dependent (B) and AMPK independent (C) genes. (D) H3K27ac peak-wise hierarchical clustering heat map of 1,502 differentially enriched peaks in response to metformin treatment (adjusted P value ≤ 0.05) showing segregation into 4 groups. The z-score scale represents mean-subtracted regularized log-transformed read counts. Cluster 1 (n = 1142) includes peaks with increased H3K27ac enrichment in response to metformin that remains elevated when also treated with compound C (metformin increased, AMPK dependent). Enriched GO terms (top right) and transcription factor binding motifs (bottom right) are shown to the right of the heat map.

