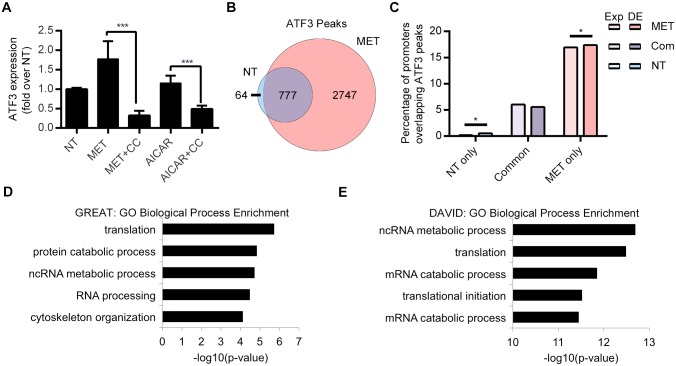
Fig 7. ATF3 ChIP-seq results.
(A) ATF3 expression analysis in Huh-7 cells treated with either vehicle control, metformin, metformin + compound C, AICAR or AICAR + compound C. (B) Venn diagram of ATF3 peaks in common (n = 777) or unique to metformin treatment (n = 2747; red), no treatment (n = 65; blue). (C) Enrichment of ATF3 peaks overlapping promoters of differentially expressed (DE) genes compared to a background of all genes with sufficient read counts to be tested for differential expression (denoted Exp). Peaks unique to non-treated (NT) and metformin treated (MET) conditions showed a significant enrichment based on a random permutation test (n = 2000, *P < 0.02), while no such enrichment was found for peaks in common (abbreviated Com) between these conditions. Enriched GO terms for all metformin unique ATF3 peaks as found by (D) GREAT and their nearest gene by (E) DAVID.

