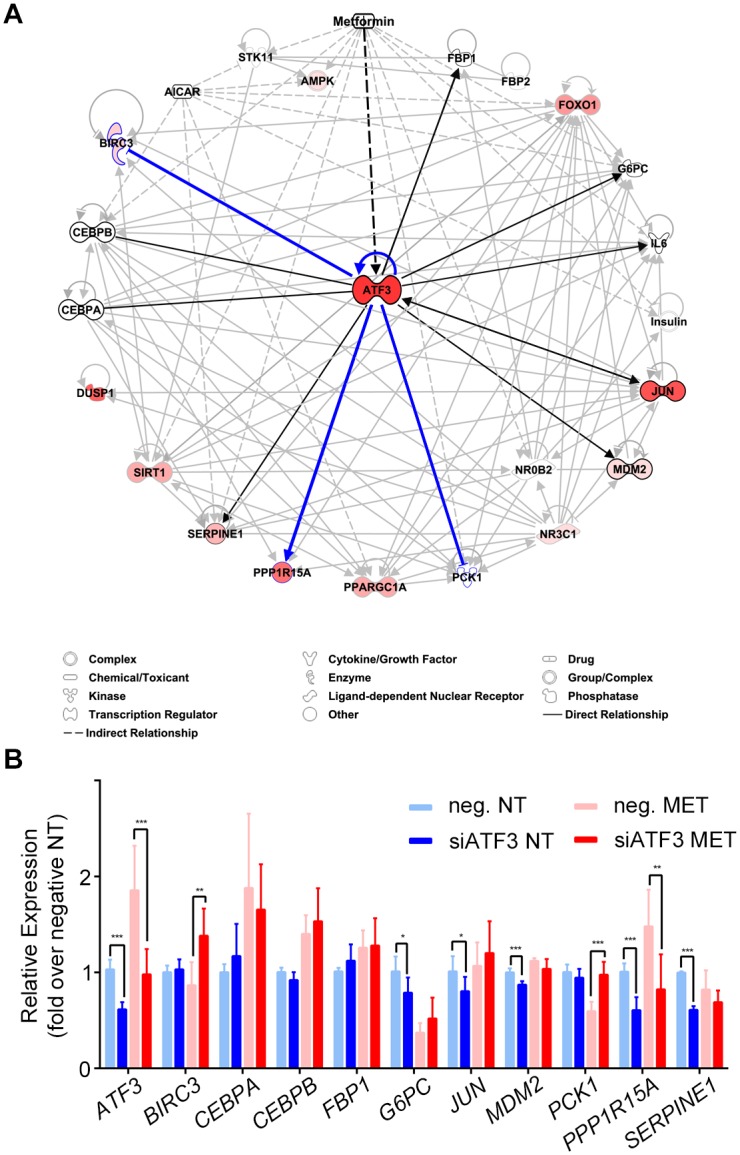
Fig 8. ATF3 pathway and siRNA analyses.

(A) ATF3 pathway analysis showing its interaction with metformin, AICAR and genes related to gluconeogenesis. Upregulated genes, as determined by RNA-seq, are colored in red. Black and blue lines show the genes assayed following ATF3 siRNA, with blue lines indicating genes that showed significant differences in expression levels in the metformin treatment following ATF3 knockdown. (B) Gene expression levels following ATF3 knockdown in Huh-7 cells treated with either negative control or ATF3 siRNA and with either 2.5 mM metformin or vehicle control for 8 hours. *P < 0.05; **P < 0.01; ***P < 0.001 (unpaired t-test).
