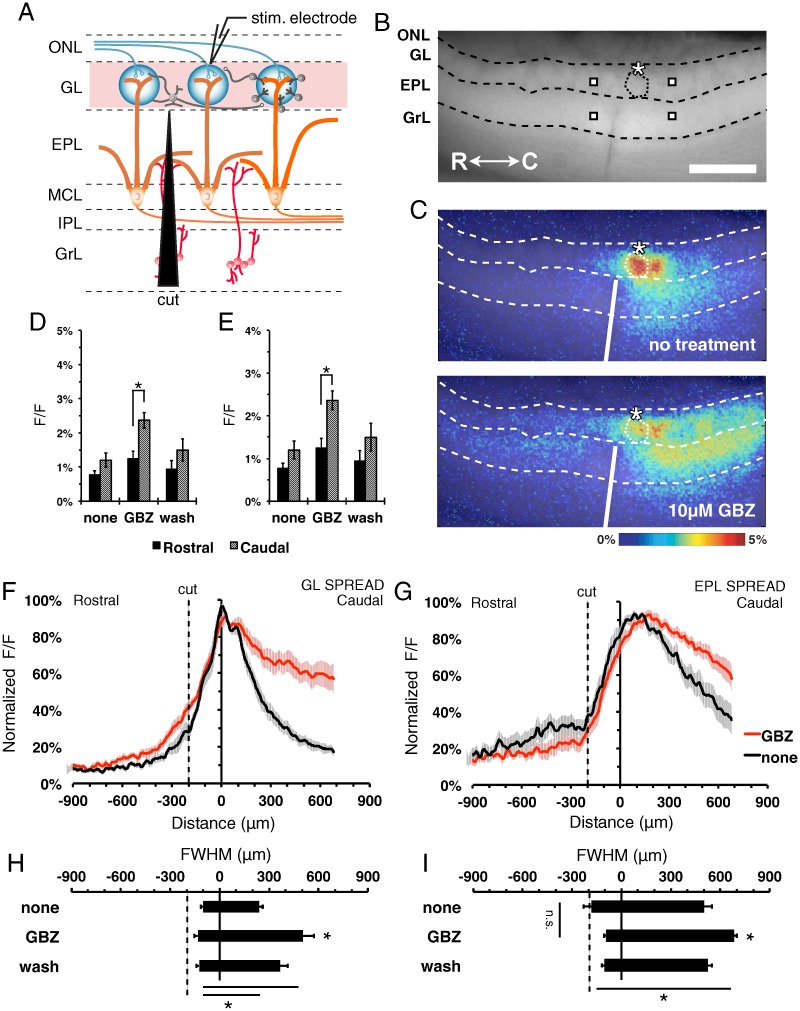
Fig 4. Lateral signal spread is dependent on the mitral-granule-mitral pathway.
(A) Schematic of the MOB circuitry with EPL surgical microcut, and preservation of the interglomerular-interneuron pathway (red highlights). ONL, olfactory nerve layer; GL, glomerular layer; EPL, external plexiform layer; MCL, mitral cell layer; IPL, internal plexiform layer; GrL, granule cell layer; PG, periglomerular cell; SA, short axon cell; ET, external tufted cell; MC, mitral cell; GC, granule cell. (B) Fluorescence image of MOB slice indicating MOB layers, microcut location. Asterisk, tip of the stimulating electrode. Targeted glomerulus indicated by dashed circle. Representative point ROIs from neighboring rostral/caudal areas (squares). Scale bar = 400μm. (C) Overlaid pseudo-colored ΔF/F stimulus-dependent responses before (top) and during GBZ treatment (bottom) at 2.5s after stimulus initiation. (D and E) Mean signal peak of the (D) GL (F(2,12) = 8.32, p = 0.005, Bonferroni t-test, n = 7) and (E) EPL (F(2,12) = 14.85, p<0.001, Bonferroni t-test, n = 7) at 360 μm rostral (black) and 360 μm caudal (gray) of the activated glomerulus. (F and G) Normalized horizontal signal traces in the GL (F) and EPL (G), before (black) and during (red) GBZ treatment. (H and I) Mean FWHM signal spread in the (H) GL (F(2,8) = 12.6, p<0.001, n = 7) and (I) EPL (F(2,8) = 6.6, p<0.001, n = 7).

